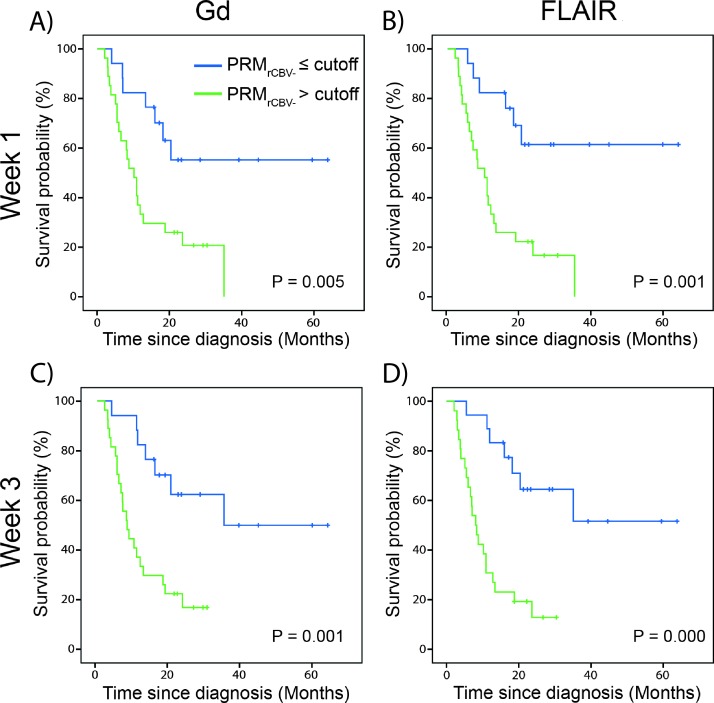
Figure 5.
Predictive value of imaging biomarkers. Kaplan-Meier survival plots for overall survival, presented as stratified by PRMrCBV- at (A, B) week 1 or (C, D) week 3 after treatment initiation and using either (A, C) Gd-VOI or (B, D) FLAIR-VOI. Blue line indicates PRMrCBV- lower than or equal to the cutoff and green line indicates PRMrCBV- more than the cutoff. The cutoff of 5.9% was defined as the mean of the optimal cutoff calculated for each PRMrCBV- at a specific time interval post-therapy and VOI (Table 2).

