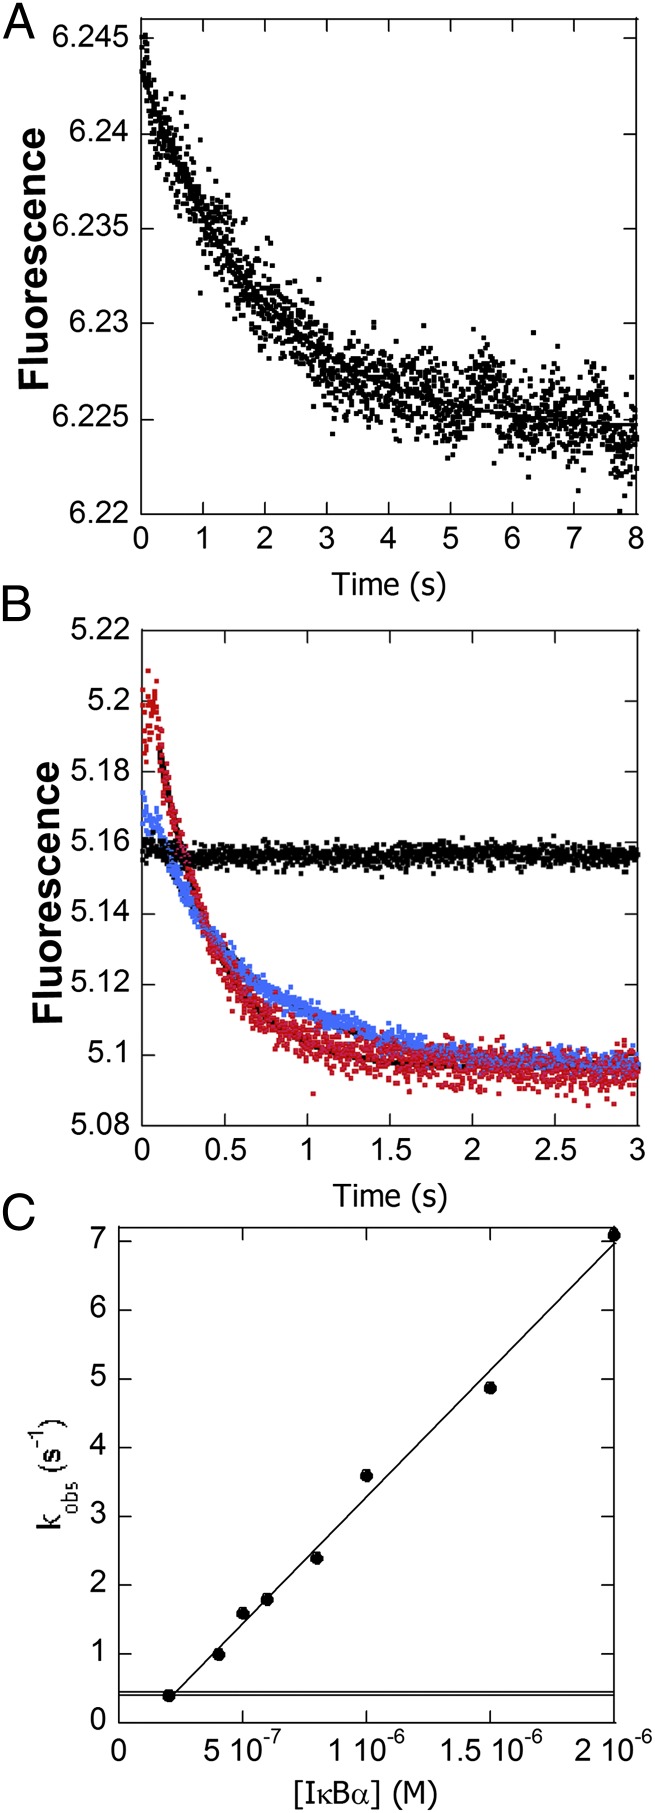
Fig. 3.
(A) Stopped-flow fluorescence trace corresponding to dissociation of DNA* from NF-κB in the presence of unlabeled DNA. (B) Fluorescence traces corresponding to the dissociation of DNA* from NF-κB in the presence of a 5-fold (blue) or 20-fold (red) excess of IκBα or no IκBα (black). Upon binding of IκBα to the DNA*–NF-κB complex, the fluorescence increased in the first 100 ms and then decreased to the values expected for free DNA*. The first part of the curve represents the formation of the transient ternary complex DNA*–NF-κB–IκBα. The DNA* dissociation phase fit to a biexponential function with the larger amplitude phase becoming more rapid with increasing IκBα concentration. (C) The dissociation rates increased linearly with IκBα concentration, yielding a rate constant for IκBα-mediated dissociation of the NF-κB–DNA* complex of 3.68 (± 0.02) × 106 M−1⋅s−1 (k3 in Scheme 1). A horizontal line marks the NF-κB–DNA* dissociation rate (0.41 s−1) in the absence of IκBα.

