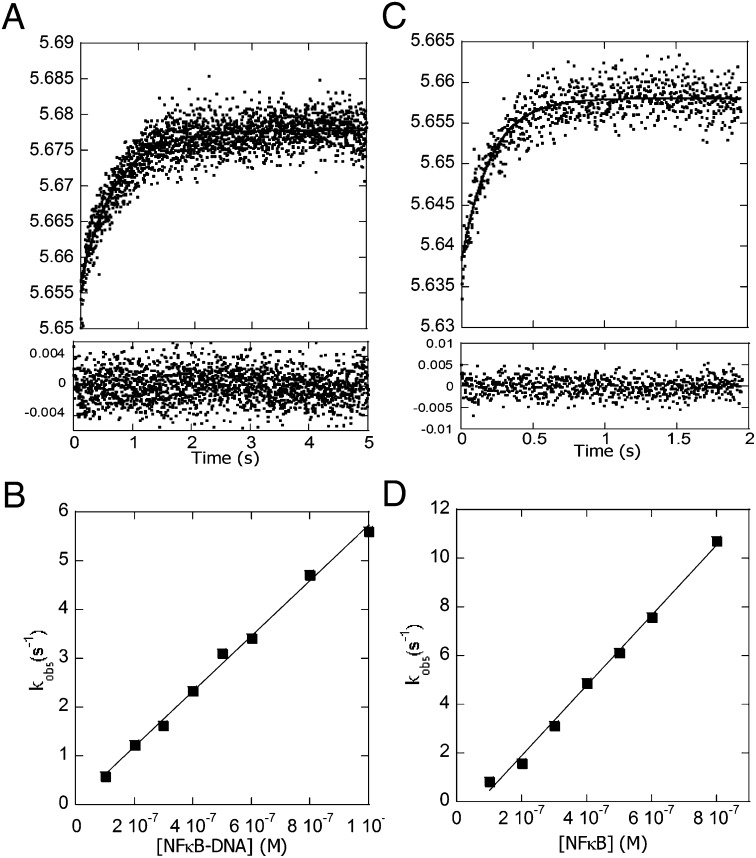
Fig. 4.
Stopped-flow fluorescence kinetic experiments in which IκBα was mixed with various concentrations of either the DNA–NF-κB complex (A and B) or NF-κB alone (C and D), and the change in intensity of the Trp fluorescence from the native W258 in IκBα was monitored. (A) Stopped-flow fluorescence trace for the association reaction (final concentrations were 0.1 μM IκBα and/or 0.4 μM DNA–NF-κB). The data fit to a single exponential, and the residuals are plotted below the graph. (B) Plot of the rates vs. DNA–NF-κB concentrations yielded a k of 5.65 (± 0.02) × 106 M−1⋅s−1 (k2 in Scheme 1). (C) Stopped-flow fluorescence trace for the association reaction (final concentrations were 0.1 μM IκBα and/or 0.4 μM NF-κB). The data fit to a single exponential, and the residuals are plotted below the graph. (D) Plot of the rates vs. NF-κB concentrations yielding a k of 1.44 (± 0.04) × 107 M−1⋅s−1 (k4 in Scheme 1).

