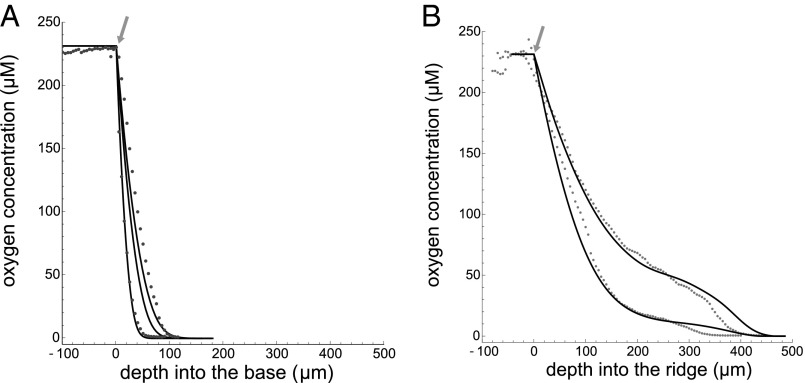
Fig. 2.
Oxygen profiles of 4-d-old colony biofilms for (A) the base region and (B) the ridge. Measured values are given by points, and simulations are represented by the solid curves. We took measurements for 37 base profiles and 27 ridge profiles over 5 d of growth, and the data in A and B represent the variation within the observed profiles. Arrows indicate the top of the biofilm surface. Data from ref. 28.

