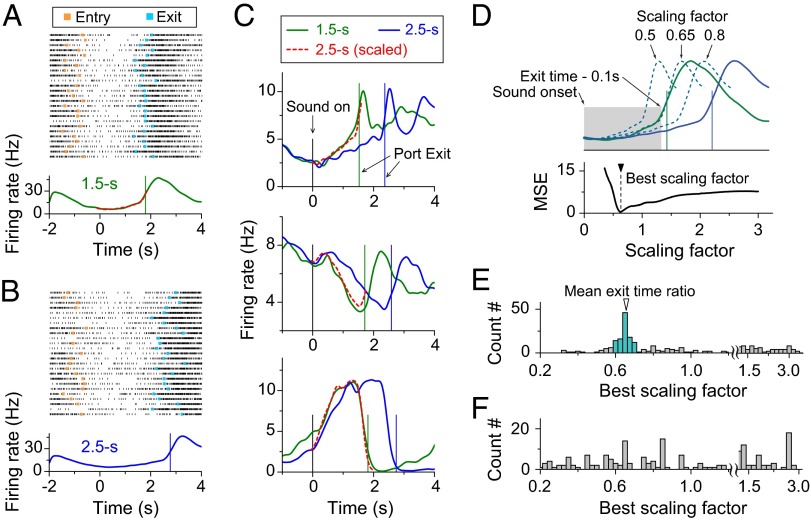
Fig. 3.
Temporal scaling of firing patterns in mPFC neurons. (A) Example of spiking activity of one mPFC neuron in a rat performing 1.5-s trials. (A, Upper) The raster plot of spiking activity for 25 consecutive trials, with each row corresponding to one trial (tick mark: single spike). Trials are aligned by the sound-onset time (zero). (Orange squares, port-entry time; cyan squares, port-exit time.) (A, Lower) PSTH (Materials and Methods) from the same session as the raster plot. The green curve shows the PSTH of neural activity in 1.5-s test trials, and the red dashed curve is the temporally scaled PSTH of 2.5-s test trials. The green vertical line shows the mean exit time. (B) Example of neural activity from the same neuron as shown in A during the same experimental session in 2.5-s test trials. (C) Examples of neuron showing the temporally scalable activity during time-estimation period. The green curve is PSTH of neural activity in 1.5-s test trials, and the blue curve is PSTH of neural activity in 2.5-s test trials. The red dashed curve is PSTH of neural activity in 2.5-s test trials scaled by the ratio between the mean exit times in 1.5-s test trials and that in 2.5-s test trials. Green vertical line, the mean exit time in 1.5-s test trials; blue vertical line, the mean exit time in the 2.5-s test trials. (D) Calculation of the best scaling factor, based on the minimum MSEs (Materials and Methods). (E) Distribution of the best scaling factor during time-estimation period (Materials and Methods); 45% (111/247) of the best scaling factors fell within ±10% from the mean exit-time ratio of 0.67 (colored histogram). (F) Distribution of best scaling factor during the random-delay period from two-interval time-estimation task. Data consist of 247 neurons from 77 behavioral sessions of four rats.

