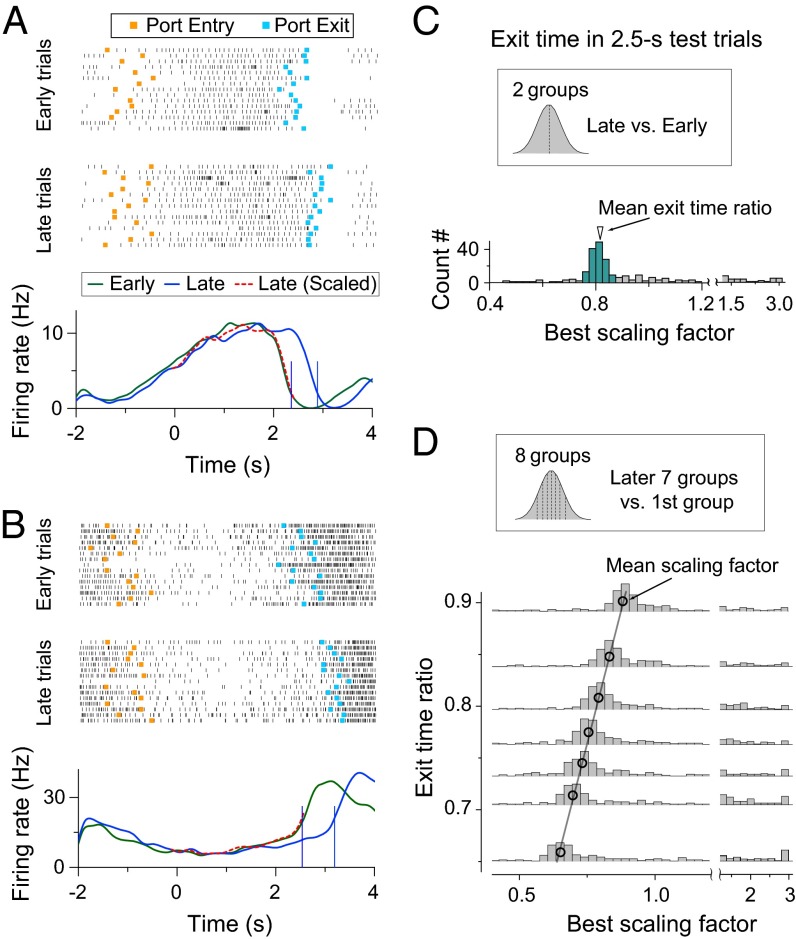
Fig. 4.
Behavioral variability and temporal scaling of neural activity in mPFC. (A and B) Two examples of neural activity in 2.5-s test trials. Trials are grouped based on the exit times into the early-exit group and late-exit group. (A and B, Top and Middle) Raster plots of spiking activity in early-exit (Top) and late-exit (Middle) trials separately are shown. (Orange squares, port-entry time; cyan squares, port-exit time.) (A and B, Bottom) The green and blue curves depict PSTH of early- and late-exit trials, respectively, and the red dashed curve represents temporally scaled PSTH of the late-exit trials. (C) Distribution of the best scaling factor between early- and late-exit trials in 2.5-s testing trials (Materials and Methods); 83% (206/247) of the scaling factors fell within ±5% from the mean exit time ratio 0.81 (colored histogram). Data consist of 247 neurons from 77 behavioral sessions of four rats. (D) Correlation between exit-time ratios and best scaling factors. Trails were divided into eight groups according the exit-time values, with the same number of trials in each group. Histograms show the distribution of best scaling factor between seven later exit groups and the first fastest exit group. Black circles mark the value of mean exit-time ratio and best scaling factor, both determined by the Gaussian fit of individual distributions. Black line, best linear fit of the black circles (r2 = 0.99).

