Fig. 5.
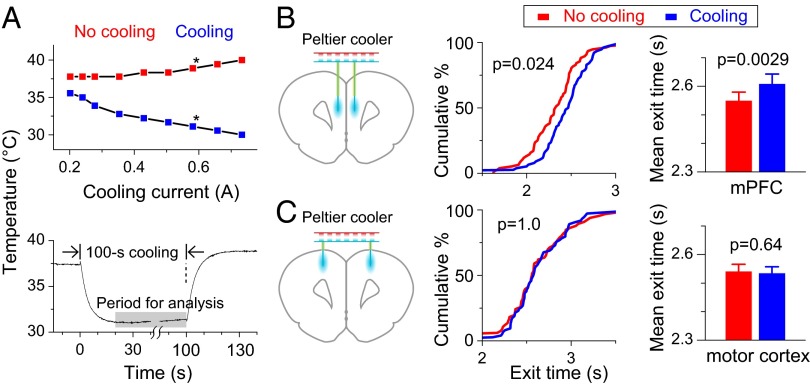
Cooling of mPFC slows the time-estimation behavior. (A) Measurement of local brain cooling. (A, Upper) Temperature changes at ∼250 μm from cooling probe using different cooling currents. (Blue and red squares, average data during the cooling and noncooling periods; star, cooling current used for behavioral experiments.) (A, Lower) Temperature changes following the onset and offset of the cooling current. (B, Left) Schematic diagram of the cooling device and position of cooling probes. (B, Center) Cumulative percentage plot of exit times with and without cooling for example behavioral session. (B, Right) Histograms summarizing results of mean exit times in 55 sessions from six rats. (C) The same cooling treatment at the motor cortices resulted in no effect on exit times. Data are from four rats in 40 sessions.

