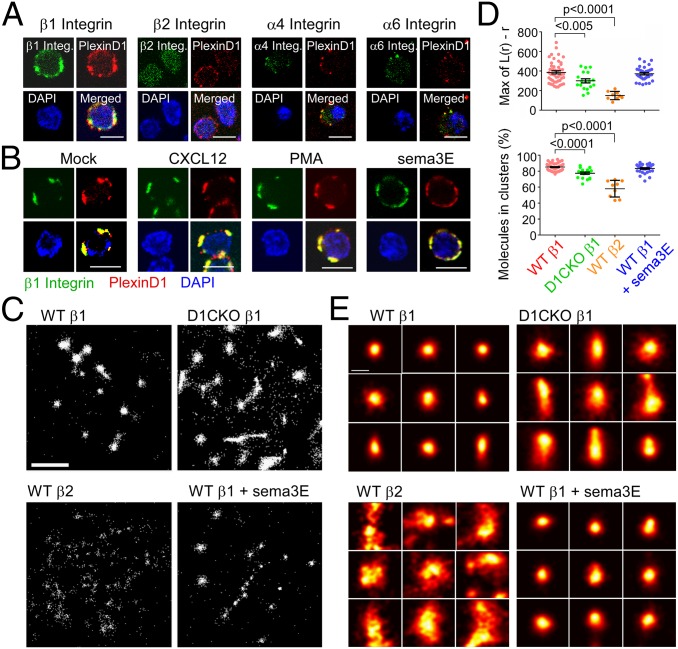
Fig. 3.
β1 integrin surface topology is controlled by plexinD1 in thymocytes. (A) Colocalization of plexinD1 with β1, β2, α4, and α6 integrins detected by confocal microscopy. Merged red and green signals depicted as yellow. Blue signal represents nuclear DAPI staining. (B) Effect of indicated stimuli on colocalization of β1 integrin with plexinD1. For A and B, each image is representative of at least 60 cells imaged. (Scale bar, 5 μm.) (C) dSTORM image analysis of individual integrin molecules (single white dots) in a representative single cell of each indicated condition. Each panel is 4 μm square. (Scale bar, 1 μm.) (D) Degree of clustering [Max L(r)-r] and β1 and β2 integrin cluster distribution for the indicated cells and conditions. Each point represents a single cell analyzed. Mean ± SEM is depicted, and P is calculated from two-tailed Student t test. (E) Morphological analysis of representative β1and β2 integrin clusters (25). (Scale bar, 100 nm.)

