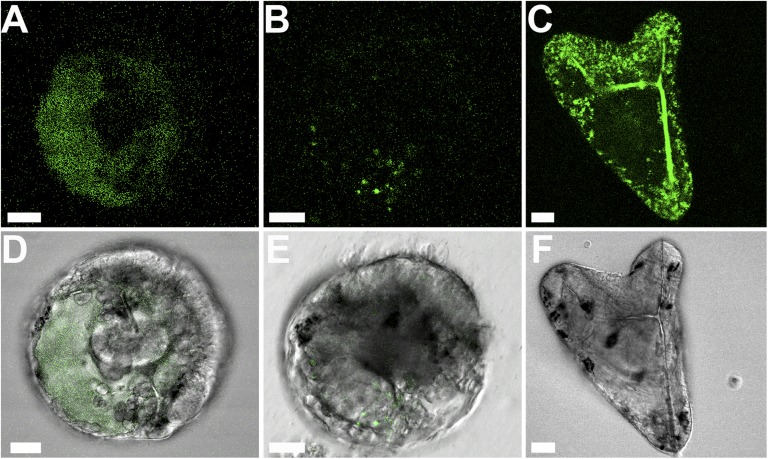
Fig. 3.
Confocal micrographs of live calcein-labeled sea urchin embryos at the gastrula stage. (A–C) Green calcein fluorescence emission. (D and E) The fluorescence image in A and B is merged with the bright-field image. (F) Bright-field image of C. (A and D) The embryo received a 10-min calcein pulse at 40 h post fertilization (hpf), followed by a 1-h chase period in sea water. Calcein appears as a cloud in the blastocoel of the embryo and is not detected in an intracellular environment. One focal plane. (B and E) The embryo received a calcein pulse of 40 min at 40 hpf, followed by a 1-h chase period in sea water. Four focal planes, 2 μm apart, were stacked together. The calcein label is observed in the cellular environment in a more concentrated manner, in both the epithelial and other cells. (C and F) Embryo that was developed continuously in calcein-labeled sea water (46 hpf). Micrometer-size calcein-labeled granules are observed all over the embryo. One focal plane. Scale bars: 20 μm.

