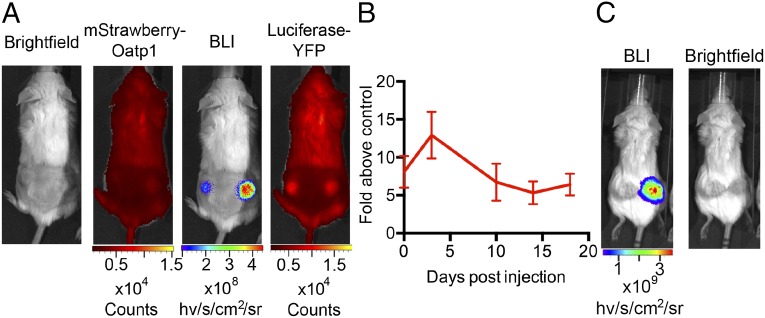
Fig. 2.
Bioluminescence measurements demonstrate expression of Oatp1 in vivo. (A) Light output was greater in the bioluminescence image (BLI) from the Oatp1-expressing HEK 293T xenograft (right flank), whereas luciferase–YFP fluorescence was the same in both xenografts. Red fluorescence confirmed expression of the mStrawberry–Oatp1 transgenes. (B) Mean increase in light output from Oatp1-expressing xenografts compared with controls expressing luciferase–YFP alone (n = 5). Points represent the average light output over 20 min following i.p. injection of luciferin. Error bars show SEM. (C) Light output was increased from a representative HCT 116 tumor expressing an inducible luciferase–E2A–Oatp1 construct, 3 d postinduction with doxycycline (10 mg/mL in drinking water), compared with the control tumor (left flank), which was not transfected with the construct.

