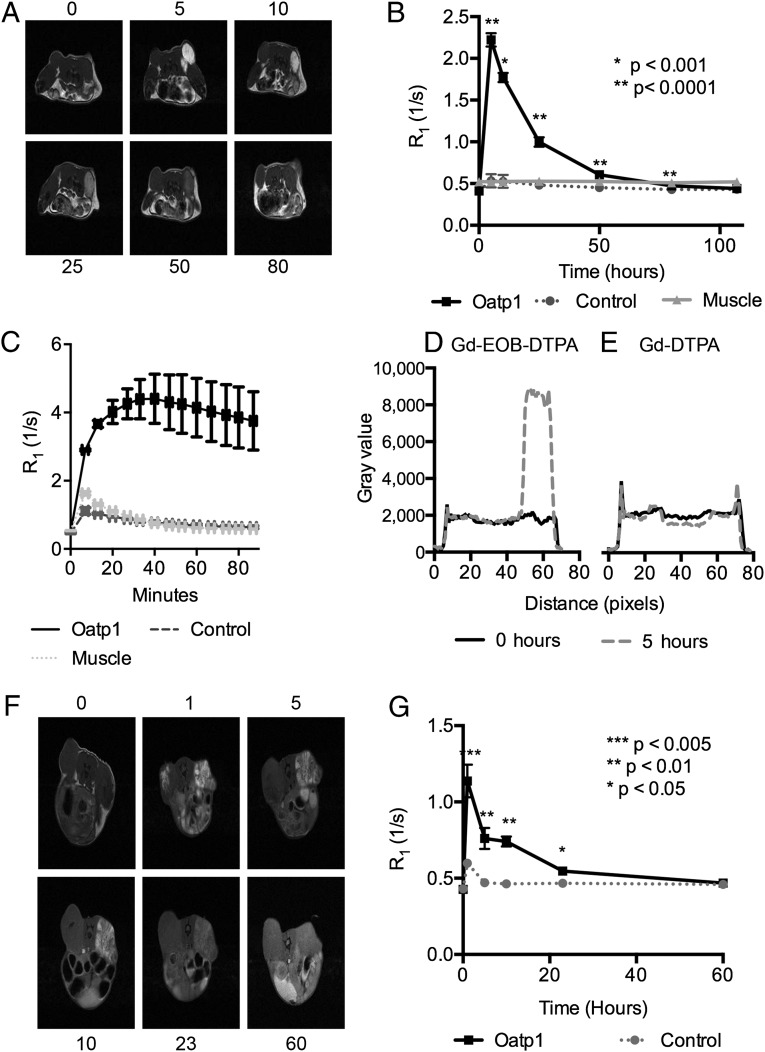
Fig. 3.
MRI of Oatp1 expression in vivo. (A) T1-weighted images before (0 h) and 5, 10, 25, 50, and 80 h after i.v. injection of Gd-EOB-DTPA, from a representative animal bearing an HEK 293T xenograft (as shown in Fig. 2). Control xenografts (left flank) expressed luciferase–YFP and the xenografts on the right flank also expressed Oatp1. (B) Xenograft relaxation rates (R1) before (0 h) and following i.v. injection of Gd-EOB-DTPA (0.664 mmoles/kg) were significantly greater compared with controls [*P < 0.001, **P < 0.0001, n = 5 (n = 4 at 107 h)]. (C) R1 increased in control and Oatp1-expressing xenografts after repeat i.v. injection with Gd-EOB-DTPA (0.664 mmoles/kg), following washout of the original dose in B and injection and washout of Gd-DTPA (E) (n = 2). Error bars show SEM. (D) Pixel intensities along a line bisecting the control and Oatp1-expressing xenografts shown in A, obtained before (0 h) and 5 h after Gd-EOB-DTPA injection. (E) The same as in D, but before (0 h) and 5 h after injection of Gd-DTPA. (F) T1-weighted images before (0 h) and 1, 5, 10, 23, and 60 h after i.v. injection of Gd-EOB-DTPA (0.664 mmoles/kg) from a representative mouse bearing a control HCT 116 xenograft (left flank) and a xenograft expressing the pTRE3G-LO construct (right flank). Animals were induced with 10 mg/mL doxycycline in the drinking water for 3 d before imaging. (G) Relaxation rates (R1) before (0 h) and following i.v. injection of Gd-EOB-DTPA. R1 was significantly greater in xenografts expressing Oatp1 compared with controls (one-tailed paired t test, *P < 0.05, **P < 0.01, ***P < 0.005, n = 4 at 0–24 h, n = 3 at 60 h). Error bars show the SEM. Some error bars are obscured by the data points.

