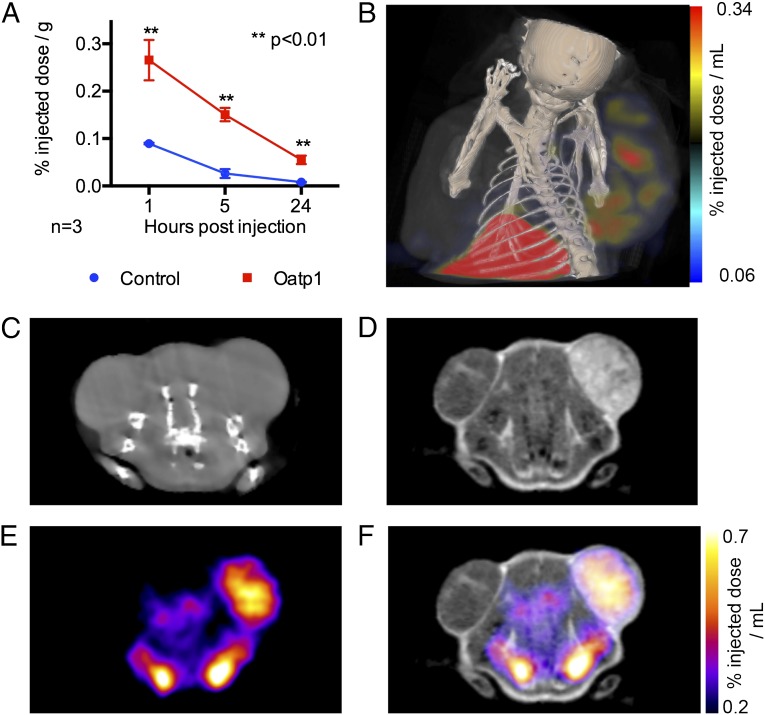
Fig. 4.
Oatp1 expression was detectable in HEK 293T xenografts using MRI and SPECT after sequential injections of Gd-EOB-DTPA and 111In-EOB-DTPA, respectively. (A) Measurements on extracted tissue showed that 111In-EOB-DTPA was taken up by Oatp1-expressing xenografts (n = 3, two-tailed t test, **P < 0.01). (B) SPECT-CT image obtained 5 h after injection of 111In-EOB-DTPA. The xenograft on the left flank was a control and the xenograft on the right flank expressed Oatp1. (C) CT image showing control (left flank) and Oatp1-expressing (right flank) xenografts. (D) T1-weighted MR image of the section shown in C, 1 h postinjection of Gd-EOB-DTPA. (E) SPECT image of the cross section shown in C, 1 h postinjection of 111In-EOB-DTPA. (F) MRI and SPECT images shown in D and E combined.

