
Fig. 3.
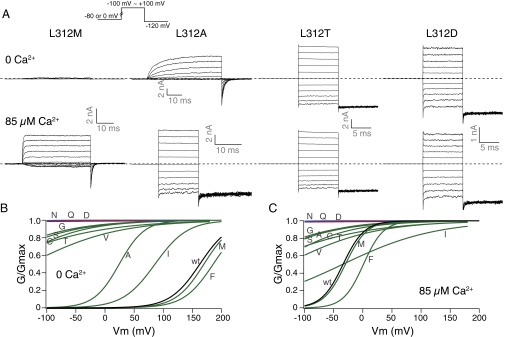
Gating of L312X mutants. (A) Trace examples of current recorded in response to families of voltage protocols (Inset), in 0 and 85 µM Ca2+ from the same patch. (B) Boltzmann fits of G–V curves for charged (red), strongly polar (blue), and other (green) side-chain substituted mutants, compared with the wild-type (black) G–V, in 0 Ca2+. (C) Comparison of G–V curves in 85 µM Ca2+. Colors are the same as in B. Letters on the curves indicate the mutant amino acids.