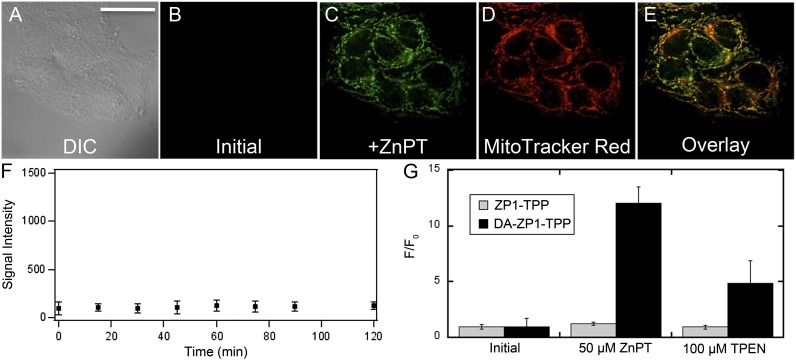
Fig. 7.
Fluorescence imaging of live HeLa cells. (A) DIC image. (B) Initial fluorescence image, showing a minimal fluorescence signal, which was stable for a period of 2 h (F). (C) Addition of 50 µM ZnPT. (D) Signal from MitoTracker Red. (E) Overlay of C and D. Pearson’s r = 0.64 ± 0.1 (n = 18). (G) Quantification of the change in fluorescence signal intensity of DA-ZP1-TPP (black bars) compared with ZP1-TPP (gray bars) under similar conditions. (Scale bar: 37 µm.)

