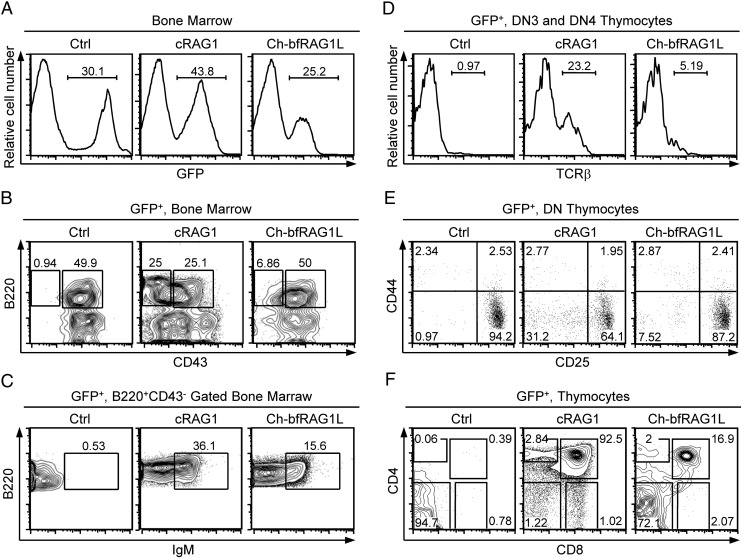
Fig. 6.
Flow cytometric analysis of B-cell and T-cell development in Ch-bfRAG1L–transfected RAG1-deficient mice. (A) The percentages of GFP-positive bone marrow cells are shown. (B) GFP-positive bone marrow cells are analyzed for the surface markers B220 and CD43. B220+CD43+ pro-B and B220+CD43− pre–B-cell populations are shown. (C) Surface expression of IgM on GFP-positive B220+CD43− bone marrow cells. (D) Surface expression of TCRβ on DN3 and DN4 thymocytes. (E) Transduced DN subsets are presented by CD44 versus CD25 profiles. Numbers indicate the percentage of DN subsets from DN1 to DN4. (F) CD4 and CD8 expression on GFP-positive thymocytes; number represents the percentage of cells in that gate. Ctrl, bone marrow cells only expressing GFP protein. The results are representative of two (A–C) or three (D–F) independent experiments.

