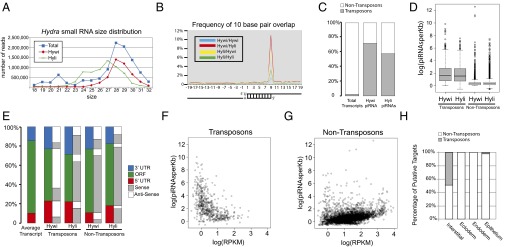
Fig. 3.

Sequencing and mapping of Hywi- and Hyli-bound piRNAs reveals conserved mechanisms of piRNA biogenesis and candidate posttranscriptional targets. Small RNAs isolated by size and piRNAs bound to Hywi or Hyli were sequenced. (A) Analysis of the size distribution of total small RNAs (blue squares) in Hydra reveals a peak at 21 nucleotides in length and a peak at 28 nucleotides in length. piRNAs bound to Hywi (red diamonds) have a peak at 28 nucleotides, and piRNAs bound to Hyli (green rectangles) have a peak at 27 nucleotides. (B) Hywi- and Hyli-bound piRNAs have a high frequency of complementary overlap 10 bases from their 5′ end. (C) A Hydra transcriptome was assembled and piRNAs were mapped to it. Transposon sequences represent 2.2% of the sequences in the transcriptome. By contrast, 72% of mapping Hywi-bound piRNAs and 58% of mapping Hyli-bound piRNAs map to transposons. (D) A box and whisker plot analyzing the number of piRNAs mapping per kilobase of sequence demonstrated that, on average, 46 Hywi-bound piRNAs and/or 36 Hyli-bound piRNAs mapped to each kilobase of transposon transcript. By contrast, nontransposon transcripts have on average only two piRNAs mapping per kilobase, but 371 and 536 transcripts have more than 10 Hywi- or Hyli-bound piRNAs mapped per kilobase, respectively (with 188 transcripts common to both populations). (E) piRNAs mapping to the UTRs are slightly overrepresented compared with the coding region per kilobase of transcript; the architecture of the average transcript in the assembly is represented by the first bar. For transposon transcripts, the majority of Hywi-bound piRNAs map in the antisense orientation (white), and the majority of Hyli-bound piRNAs map in the sense orientation (gray). The majority of both Hywi- and Hyli-bound piRNAs that map to nontransposon transcripts map in the sense orientation (see SI Appendix, Table S1 for percentages). (F and G) Number of piRNAs bound per transcript (normalized by transcript size) as a function of transcript abundance as measured by RPKM (reads per kilobase per million reads) value. (F) The majority of transposon transcripts are in low abundance and have a high number of piRNAs mapping to them. (G) By contrast, the majority of nontransposon transcripts show a correlation between transcript abundance and the number of piRNAs mapping to them, suggesting that some transcripts may be processed due to their abundance. (H) To identify lineage-specific targets of the PIWI–piRNA pathway, small RNAs were isolated from FACS separated interstitial, ectodermal, and endodermal lineages. Small RNAs greater than 23 nucleotides long were mapped to the transcriptome. Approximately 50% of the putative targets in the interstitial lineage are transposons, whereas no transposon targets were identified as specific to the ectoderm or endoderm. One putative transposon target was identified in the epithelium (combination of ectoderm and endoderm) that is enriched over the interstitial lineage.
