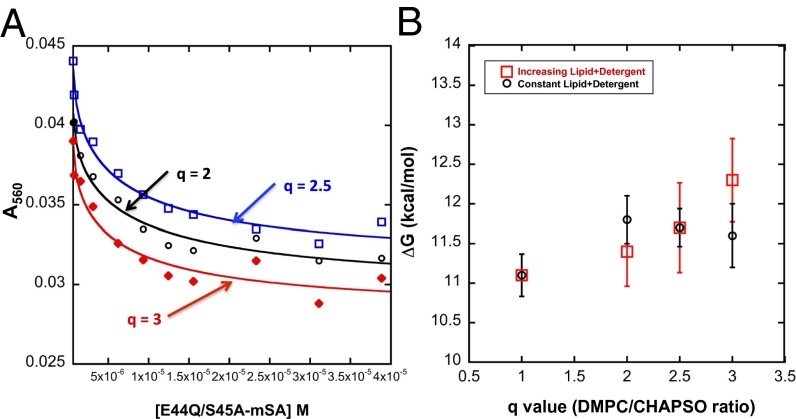
Fig. 5.
The stability of bR measured by steric trapping in bicelle conditions. (A) Steric trapping binding curves in bicelle environments. The total DMPC+CHAPSO concentration was constant in these assays at 31 mM. The black circles, red diamonds, and blue squares show the results for q = 2, q = 2.5, and q = 3, respectively. The lines are the fitting results using Eq. 6. (B) The observed free energy change as a function of q value under two sets of conditions. Red squares: The CHAPSO concentration was held constant while the DMPC concentration was increased. Black circles: The total CHAPSO and DMPC concentration was kept constant.

