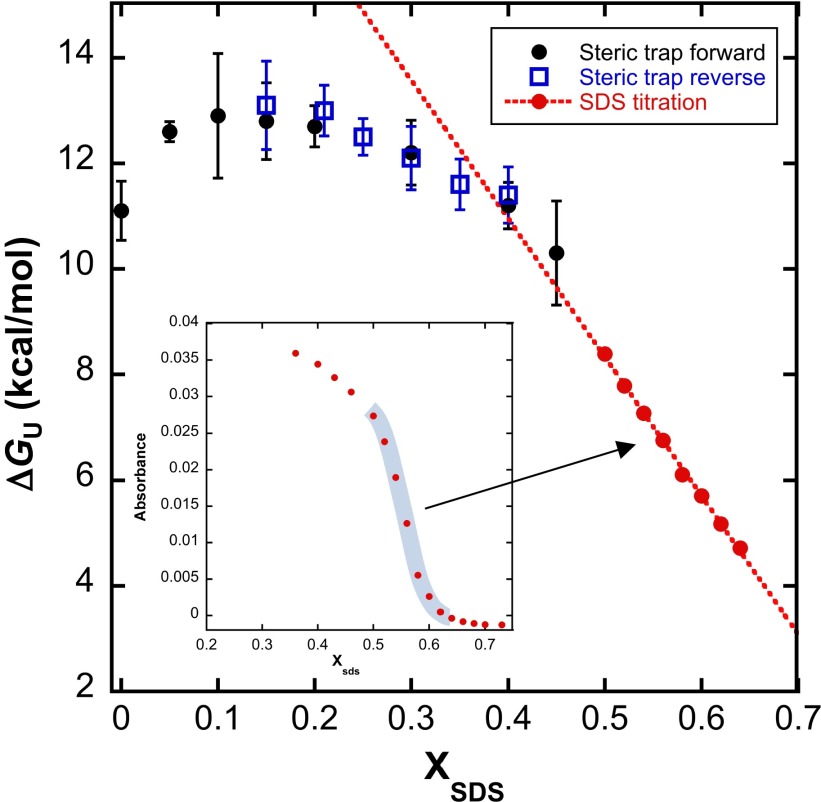
Fig. 6.
bR stability as a function of SDS concentration. Shown is the free energy dependence as a function of XSDS, as determined by different methods. Black circles are the results from forward steric trapping reactions. Open blue squares are results from reverse steric trapping reactions. The red circles are the results from SDS titration experiments (Inset). The plotted unfolding free energies were obtained from the transition zone, highlighted by the blue shading, where XSDS is around 0.5–0.65. The red dashed line is the linear fitting from SDS titration results. The extrapolated unfolding free energy at XSDS = 0 is 26 kcal/mol. As shown, results from forward and reverse reactions have a good agreement in the overlapped region. Distinct nonlinearity is observed between 0 and 0.4 XSDS. All of the ΔGU values were calculated using a 1-M standard state.

