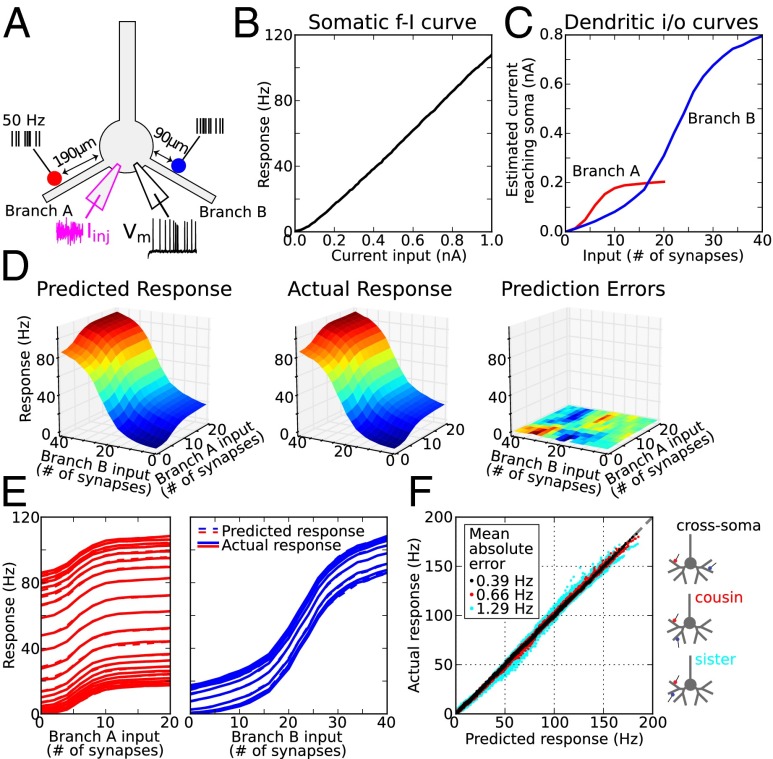
Fig. 2.
Quantifying subunit independence in a simple case: one stimulus site on two dendrites. (A) Schematic of the simulation experiment. Red and blue dots show stimulus locations. Every synapse at each site was driven by an independent 50-Hz Poisson train. A noisy current injection at the soma of 0.75 ± 1 nA set the background firing rate to ∼0.5 Hz, modeling the effects of random network input. (B) Somatic f-I plot. (C) Estimated current arriving at the soma from branch A (red) and branch B (blue) based on the regression fit to actual responses (SI Materials and Methods). Sigmoidal i/o curves for this pair of branches and locations had thresholds (i.e., inflection points) at 5 and 20 synapses, respectively. (D, Left) Predicted firing rates based on plots in B and C and assumption of subunit independence (i.e., that dendritic currents add at the soma). (Center) Actual responses are nearly identical. (Right) Prediction errors (actual–predicted) are very small; color indicates firing rate errors from −1.2 Hz to +1.6 Hz. (E) Slices of the 3D plots in D allowing comparison of predicted (dashed) and actual (solid) firing rates from two orthogonal views. Vertical progression of curves in each plot is due to increasing stimulus intensity in the other branch. (F) Scatterplot of actual vs. predicted firing rates for 81 different stimulus location pairs on two branches (9 × 9, 50–210 μm on each branch in 20-μm steps) for inputs to a pair of cross-soma dendrites (black, mean absolute error MAE = 0.39 Hz; same pair of dendrites was used as in A–E), a pair of cousin dendrites in the same subtree (red, MAE = 0.66 Hz), and a pair of sister dendrites with the same parent (cyan, MAE = 1.29 Hz). See Figs. S1–S5 for control experiments and Fig. S6 for illustrations of synaptic locations on the neuron model.

