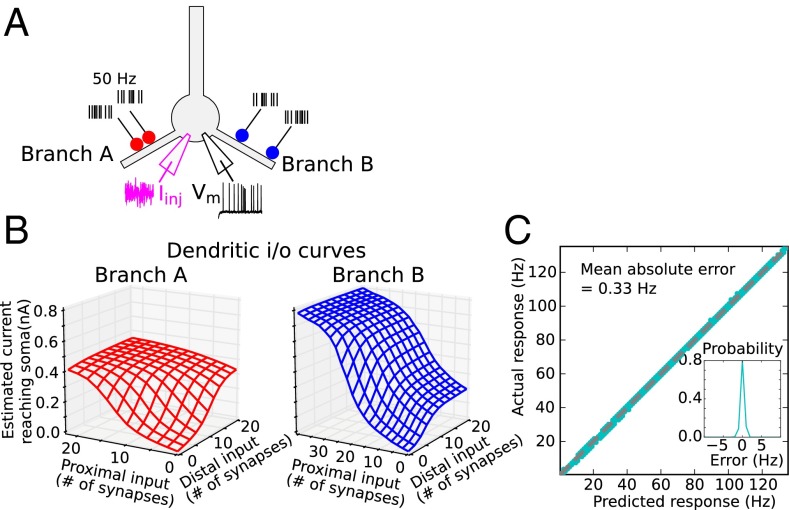
Fig. 3.
Quantifying subunit independence with two stimulus sites on two dendrites. (A) Simulation experiment was as in Fig. 2 but with two stimulus sites on each dendrite (130 and 150 μm on branch A and 90 and 190 μm on branch B). (B) Estimated current reaching the soma for location pairs on branch A and branch B, respectively, computed from regression fits to actual responses. Nonlinear interactions between proximal and distal inputs within each branch lead to asymmetric 2D sigmoidal surfaces, more so in branch B with greater separation of the sites (31). Somatic f-I curve used in generating predictions was the same as in Fig. 2B (over a larger range). (C) Scatterplot of actual vs. predicted firing rates for 384,000 stimulus configurations shows predictions are again close to perfect (MAE = 0.33 Hz). (Inset) Probability density of prediction errors (actual–predicted).

