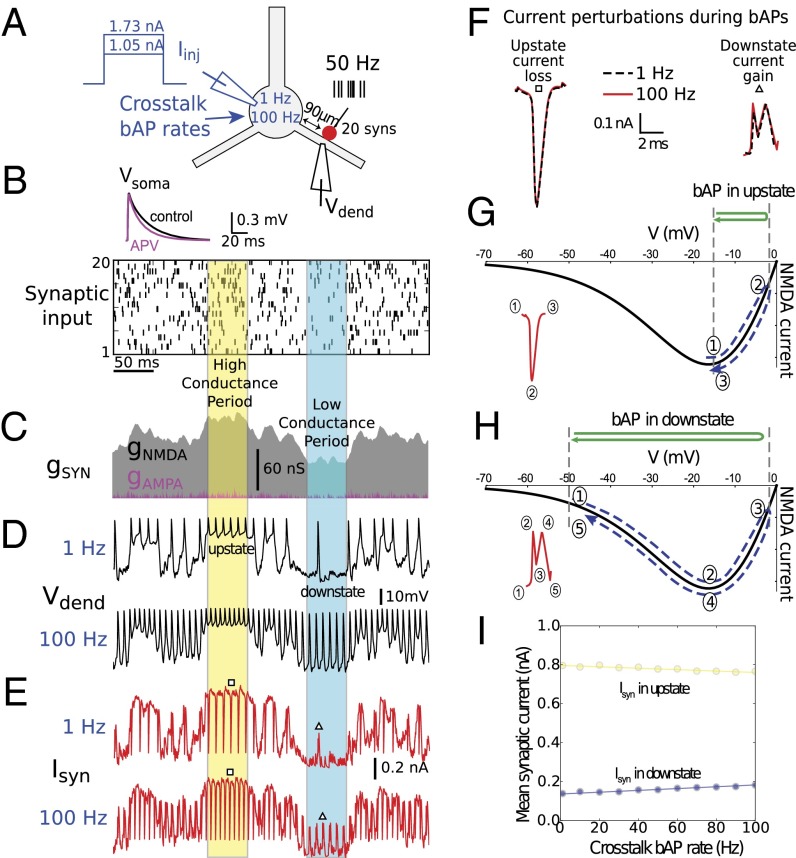
Fig. 4.
Analysis of synaptic current perturbations by bAPs. (A) Schematic showing simulation experiments for two levels of somatic current injection, producing low (1 Hz) and high (100 Hz) “cross-talk” bAP rates. (Inset) Somatic response to activation of a single synapse at rest, 90 μm from the soma, with NMDA conductance present (control) and blocked by 2-amino-5-phosphonovaleric acid (APV). (B) Twenty mixed AMPA–NMDA synapses (90 μm from the soma, ratio of NMDA to AMPA peak conductance was 2.5) were activated by independent 50-Hz Poisson spike trains, as shown in raster plot. Identical spike raster was used for both cross-talk cases. (C) Total synaptic conductance for all 20 synapses. Periods of relatively high and relatively low NMDA conductance are indicated. (D) Dendritic membrane potential in response to synaptic stimulation at two levels of cross-talk (Upper and Lower traces) with superimposed somatic bAPs. An up state and a down state are indicated, corresponding to the high and low conductance periods. bAPs in excess of the cross-talk bAP rate were due to synaptic stimulation, which causes additional somatic APs. (E) Total synaptic current at two levels of cross-talk. Inward currents are plotted in the positive direction. bAPs caused transient losses of synaptic current during up states (downward blips) and transient boosts during down states (upward blips). (F) bAP-induced synaptic current perturbations during up and down states were stereotyped in shape/size. Examples corresponding to squares and triangles in E are shown superimposed. (G and H) Monotonic form of current loss during up state (G) and double-humped current boost during down state (H) are explained by bAP-induced traversal of NMDA I–V curve from different voltage baselines. (I) Small magnitude of individual current perturbations [roughly 0.5 picocoulombs (pC) per bAP in down state and −0.45 pC per bAP in up state] led to only small changes in mean synaptic current in worst case (pure up or down states) over 1- to 100-Hz range of cross-talk bAP rates. See also Fig. S7.

