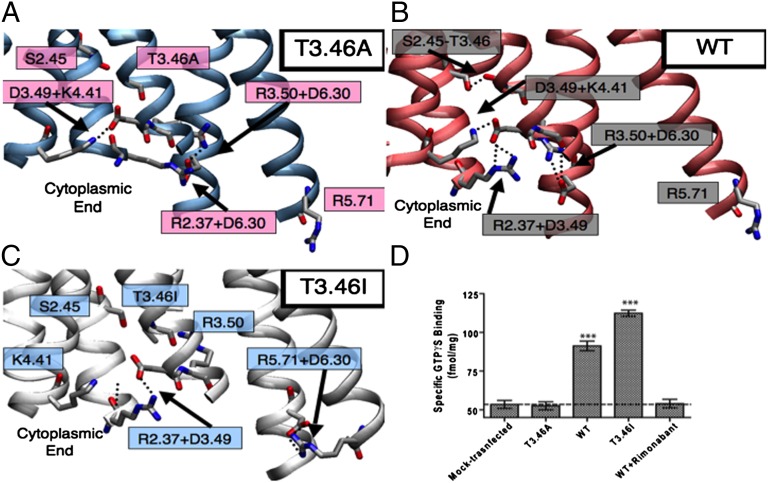
Fig. 7.
(A–C) Predicted structures of the T3.46A, WT, and T3.46I CB1 GPCRs, showing the salt bridges and hydrogen bonds formed on the cytoplasmic side. (D) Comparison of basal GTPγS binding to HEK293 cell membranes expressing the CB1 receptors including the double mutants (8).

