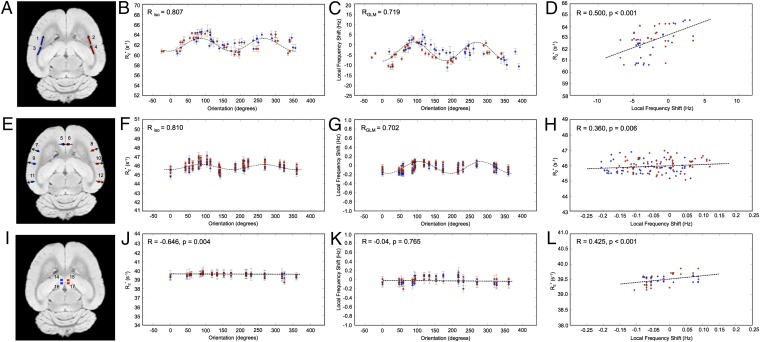
Fig. 2.
 and fL changes observed in gray and white matter as a function of fiber orientation relative to B0 (for white matter) and surface normal orientation relative to B0 (for gray matter). The ROIs used for this analysis are displayed in A, E, and I. The linear
  model is overlaid on B and F. The GL model fit is overlaid on C and G. J and K demonstrate the
  and fL changes observed in the basal ganglia structures as a function of brain orientation. D, H, and L demonstrate the linear relationships between the orientation dependence of
  and fL in white and gray matter. Error bars in B–D, F–H, and J–L represent SEM.

