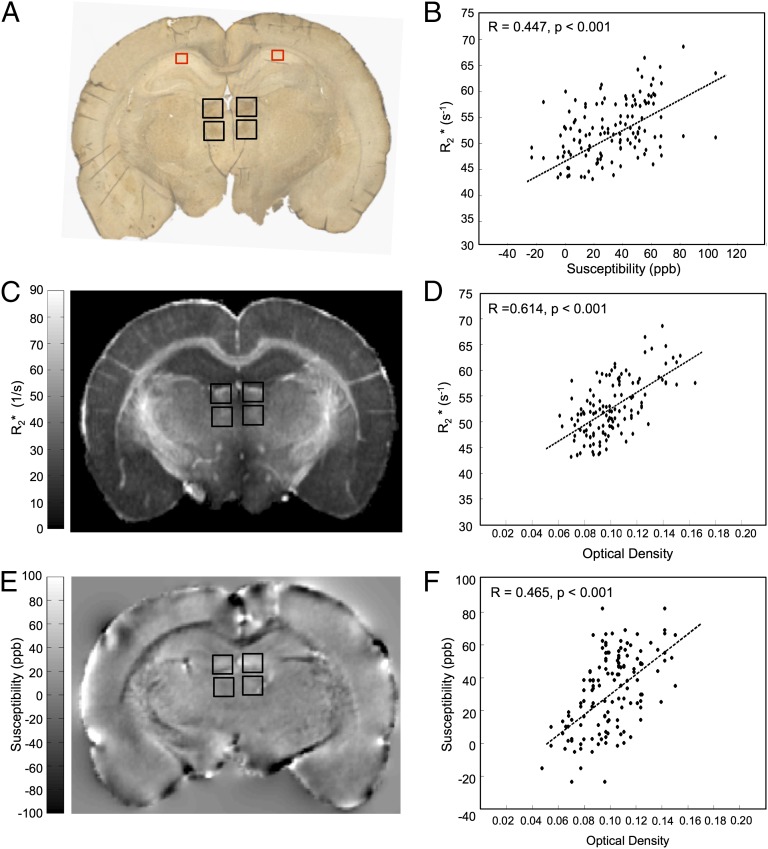
Fig. 4.
 and quantitative susceptibility values in the lateral habenular and mediodorsal nuclei (deep brain basal ganglia structures) of the rat brain positively correlate with Fe3+ density from DAB-enhanced Perls staining. (A) A representative coronal section of a rat brain stained with DAB-enhanced Perls is shown. Black boxes indicate the ROIs in which OD and quantitative MRI values were measured (these same ROIs are also overlaid on both the
  map in C and the QS map in E). ROIs include the right and left lateral habenular nuclei and the right and left mediodorsal nuclei. Red boxes indicate reference ROIs used in computation of OD. The corresponding coronal MRI sections of a rat brain are displayed in C for
  (in units of 1/s) and E for quantitative susceptibility (in units of ppb). B displays a positive linear correlation between
  and Δχdipole in the rat basal ganglia. The correlation of
  (D) or Δχdipole (F) with OD measurements are also shown. Each data point represents a voxel from the chosen ROIs. The black dotted lines indicate the linear regression fit to the data. R and P values are indicated in the upper left-hand corner of the correlation plots.

