Fig. 5.
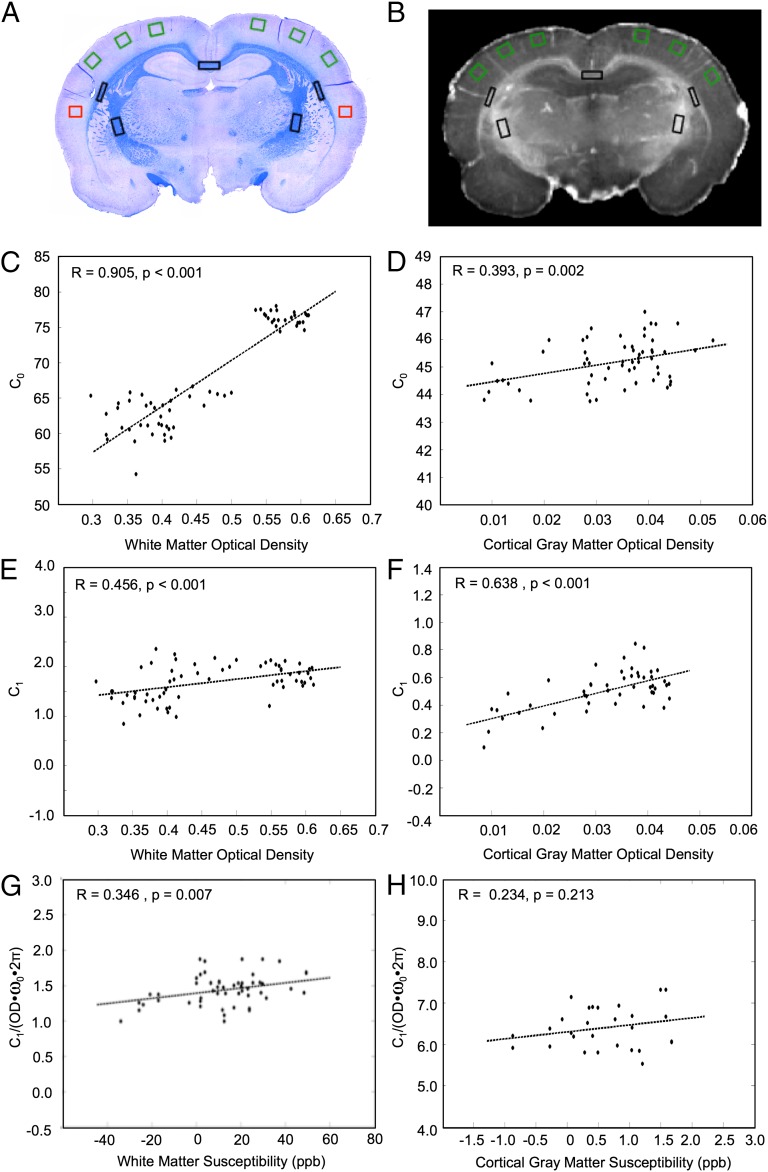
The constants, C0 and C1, derived from the linear  orientation model correlate positively with OD of ScR staining for myelin in both major white matter tracts and cortical gray matter. (A) A representative coronal section of the rat brain stained for myelin. (B)
  map corresponding to the myelin stain. Black boxes in A and B indicate the ROIs in which the OD of myelin, C0 and C1 were measured in white matter. Green boxes in A and B indicate the ROIs in which the OD of myelin, C0 and C1 were measured in cortical gray matter. Red boxes indicate reference ROIs employed in the computation of OD. C0 (C and D) and C1 (E and F) correlated positively with the myelin OD in major white matter tracts and cortical gray matter. Each data point represents a voxel from the chosen ROIs. (G and H) Linear relations between the value of C1, calculated from fitting the linear
  model, and Δχ, calculated from the GL model for both white (G) and gray (H) matter. C1 and Δχ are related through Eq. 3. The OD was used as a surrogate for the volume fraction (ζ) of perturbers in these plots.

