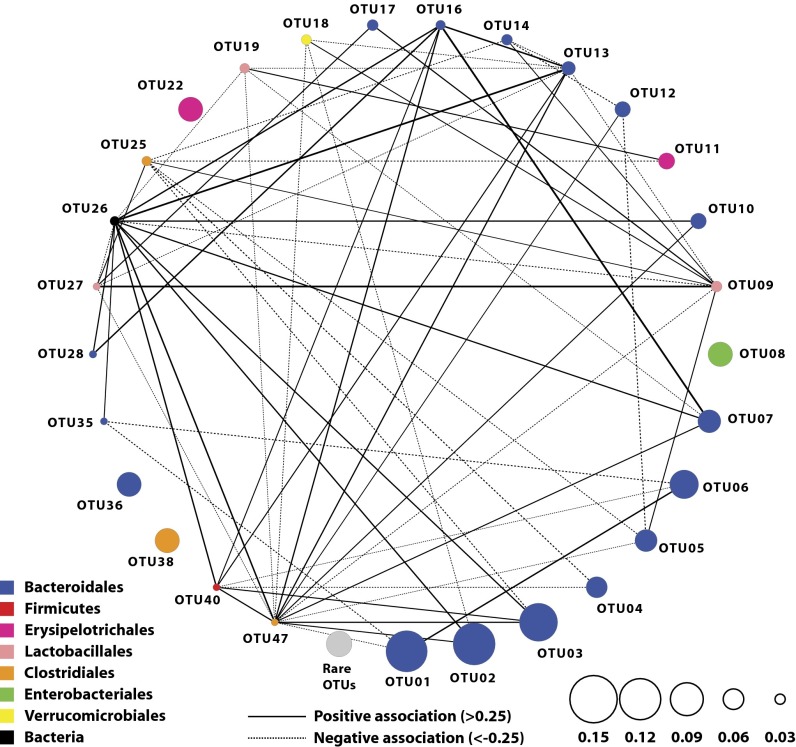
Fig. 3.
Association network describing the co-occurrence patterns between OTUs that had a correlation value less than −0.25 or larger than 0.25. OTUs 8, 22, 36, and 38 had an average relative abundance of at least 0.5% in individual mice but were not included in the correlation analysis because they did not meet the threshold abundance in all mice.

