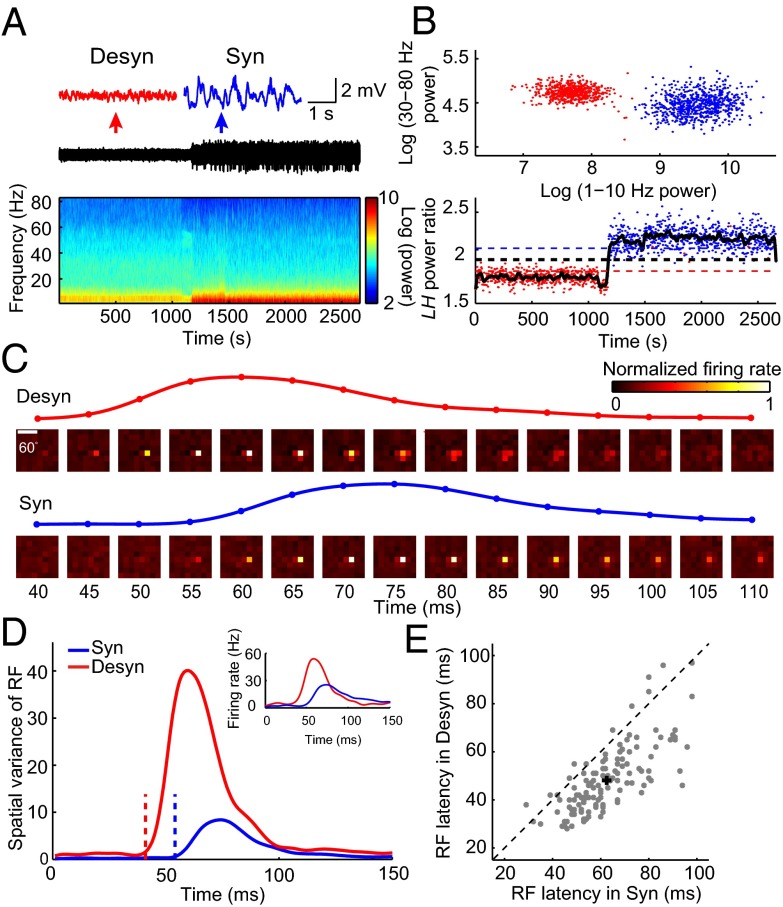
Fig. 2.
Latency of spike RF in V1 depends on brain state in anesthetized rats. (A) LFP trace and its power spectrum for an anesthetized rat. Insets above, magnified LFP traces of 4-s recording for a period in the desynchronized state (marked by the red arrow) and the synchronized state (marked by the blue arrow), respectively. (B) Cluster analysis of LFP power, same as described in Fig. 1B. (C) Spatiotemporal RF maps of an example V1 neuron, same as described in Fig. 1C. Traces above show the time courses of the spatial variance of RF from 40 to 110 ms after stimulus onset. (D) Time courses of the spatial variance of RF in desynchronized (red) and synchronized (blue) states for the cell shown in C. The dashed lines mark the latencies of RF (desynchronized state: 41 ms; synchronized state: 54 ms). Inset shows the spiking responses to the most effective stimulus pixel in the RF (red, desynchronized state; blue, synchronized state). (E) Summary of the RF latencies in desynchronized and synchronized states for anesthetized rats (n = 127, P = 2.0 × 10⁻²⁰, Wilcoxon signed rank test). Error bars represent ±SEM.

