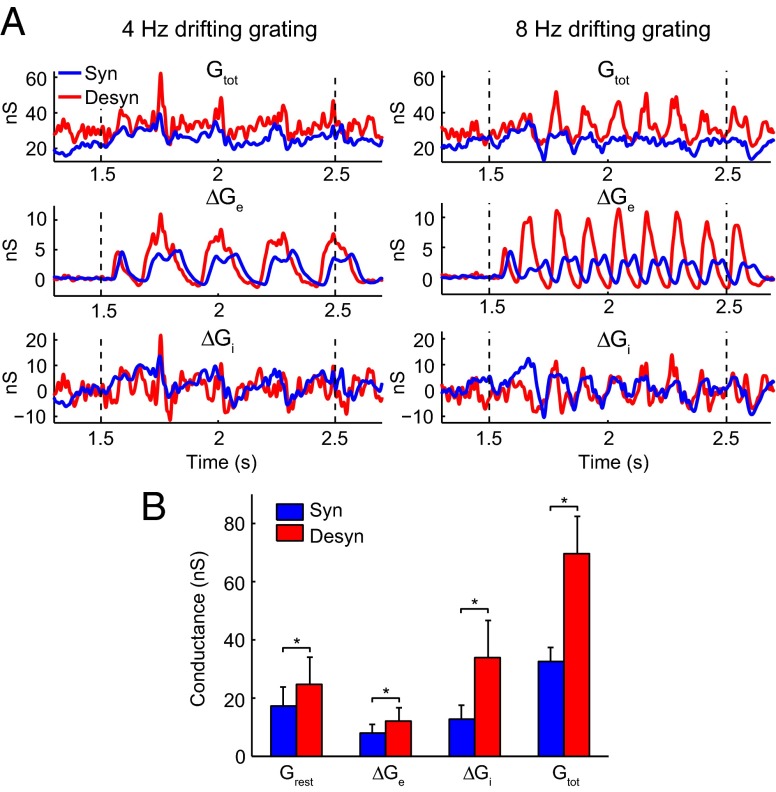
Fig. 4.
Comparison of membrane conductance for V1 neurons between two brain states. (A) Conductance of an example neuron in synchronized (blue) and desynchronized (red) states measured with 4-Hz gratings (left column) and 8-Hz gratings (right column). The dashed lines denote onset and offset of drifting grating. Top row, total membrane conductance ( ).
).  was calculated from the spontaneous activity before the onset of drifting grating. Middle row, evoked excitatory synaptic conductance (
 ). Bottom row, evoked inhibitory synaptic conductance (
 ). (B) Increase of conductance in the desynchronized state (n = 7). The evoked conductances were measured by the magnitudes of peak conductances. For cells measured with both 4- and 8-Hz gratings, we averaged the magnitudes measured under the two gratings. Error bars represent SEM. *P < 0.05, Wilcoxon signed rank test.

