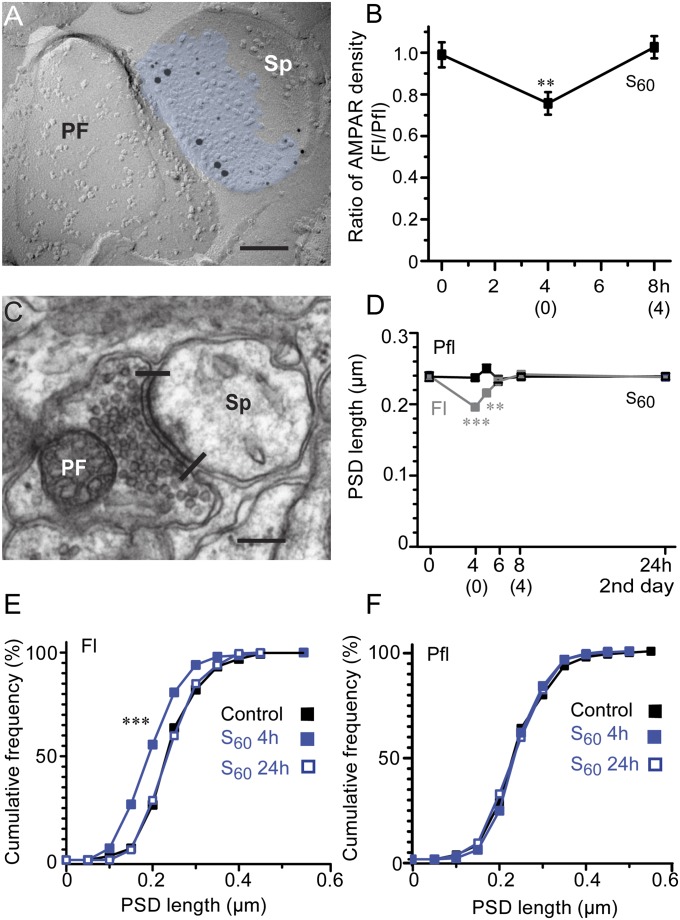
Fig. 2.
Immediate reduction in AMPAR density at PF–PC synapses in Fl and their shrinkage during acquisition of HOKR adaptation by spaced training. (A) An EM image of replica immunolabeled for AMPARs (5-nm particles) in PF–PC spine synapse (Sp) identified by labeling for GluD2 (15-nm particles). The density of AMPAR labeling is calculated by dividing the number of immunogolds for AMPARs/synapse with area of intramembrane particle clusters (blue). (B) Pooled data showing significant reduction of AMPAR density after training (4 h) but not at 4 h after training (8 h) in S60 training. (0) and (4) on x axis represent time after training. Ratios of AMPAR density in Fl compared with those in Pfl are shown (n = 5 each, **P < 0.01, paired t test). (C) PF–PC synapse showing PSD length in single ultrathin sections (edges indicated by lines). (D) Time course of changes in PSD length shows significant shrinkage at the end of training (4 h) and 1 h after S60 training with no change at 4 h after training (8 h) and on day 2 (24 h) in Fl (4 h, ***P < 0.001; 5 h, **P < 0.01; n = 300 for all, MWU test). (E) Significant leftward shift of cumulative distributions of PSD length in Fl detected at S60 4 h (blue filled square; ***P < 0.001, two-sample K–S test) but not at S60 24 h (blue open square) compared with control (black filled square). (F) No change was detected at any time points in Pfl. (Scale bar, 0.2 µm in A and C.)

