Fig. 3.
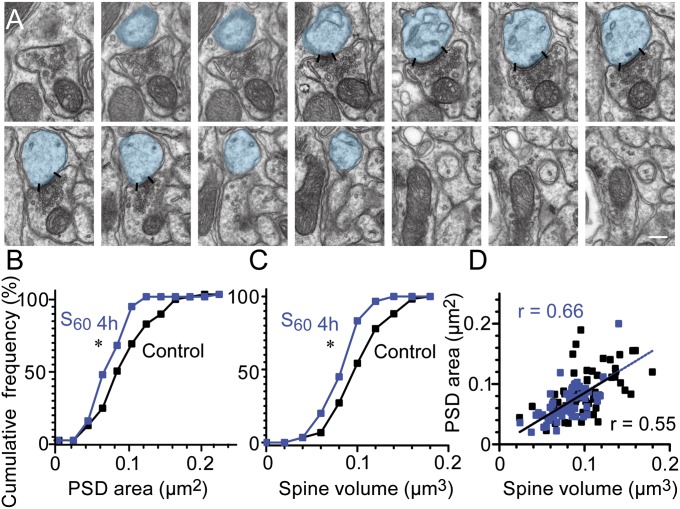
Simultaneous shrinkage of synapse and PC spine at the end of spaced training. (A) Serial EM images of a PC spine used to measure PSD area (edges indicated by lines) and PC spine head (blue) volume. Last three serial sections represent the neck of spine and were not used for spine head volume estimation. (Scale bar, 0.2 µm.) (B and C) Cumulative frequency plots showing significantly smaller PSD (leftward shift) (B) and spine size (C) just after the completion of S60 training (S60 4 h, n = 60; blue) compared with control (black; n = 60, *P < 0.05, two-sample K–S test). (D) Scatter plot showing positive correlation of the spine head volume and PSD area in both control and S60 4 h (control, r = 0.55, black line; S60 4 h, r = 0.66, dashed blue line; ***P < 0.001 for both groups, Pearson correlation).

