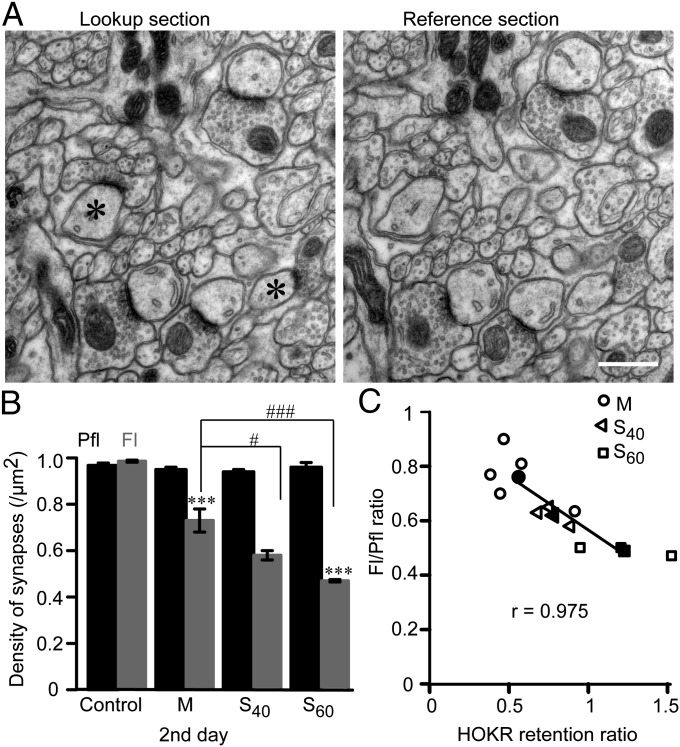
Fig. 4.
Strong negative correlation between reduction of PF–PC synapses in Fl and retention of HOKR gain on the second day. (A) Consecutive EM sections (thickness of 70 nm) were used for measurement of PF–PC synapse density using physical dissector method. Synapses present in lookup section but not in the reference section were counted (*). (Scale bar, 0.5 µm.) (B) Significant reduction of PF–PC synapse density in Fl (gray) on day 2 but not in Pfl (black) following M (n = 5), S40 (n = 3), and S60 (n = 3) trainings (***P < 0.001 vs. control Fl, n = 5, one-way ANOVA). The reduction of synapse density by M is still significantly smaller than S40 (#P < 0.05) and S60 (###P < 0.001, one-way ANOVA) showing interval-dependent synapse reduction. (C) Scatter plot showing a strong negative correlation between PF–PC synapse density (Fl/Pfl ratio) and HOKR retention ratio (ratio of HOKR gain increase on day 2 to that at the end of training, r = 0.975, P < 0.001, Pearson correlation). Data from individual animals (open) and the mean (filled) from M (circle), S40 (triangle), and S60 (square) were plotted. Regression line is obtained from means of three groups.

