Fig. 7.
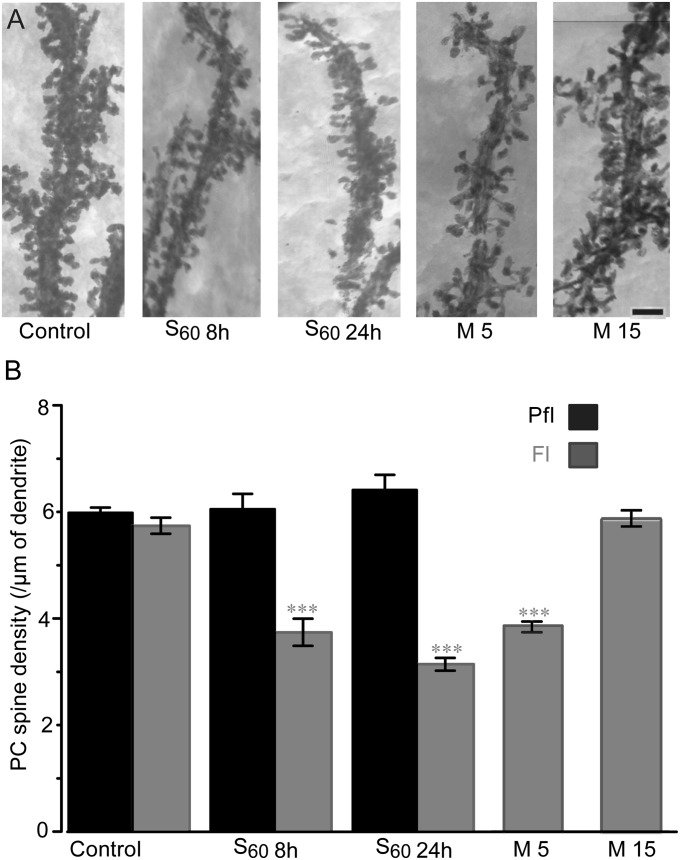
Elimination and recovery of PC spines. (A) High-voltage EM images of PC dendrites in Fl in control, 4 h after S60 (8 h), on day 2 after S60 (24 h), on day 5 (M5), and on day 15 after M (M15). (Scale bar, 2 µm.) (B) Spine densities along PC dendrites showed robust PC spine elimination selectively in Fl (gray) but not in Pfl (black) at 4 h (S60 8 h, n = 5) and 24 h (S60 24 h, n = 5) after S60 training. After M training, a similar spine elimination was observed on day 5 (M5, n = 3) compared with control Fl (n = 5, ***P < 0.001 vs. control Fl), but it recovered on day 15 (M15, n = 3, P = 0.99 vs. control Fl).

