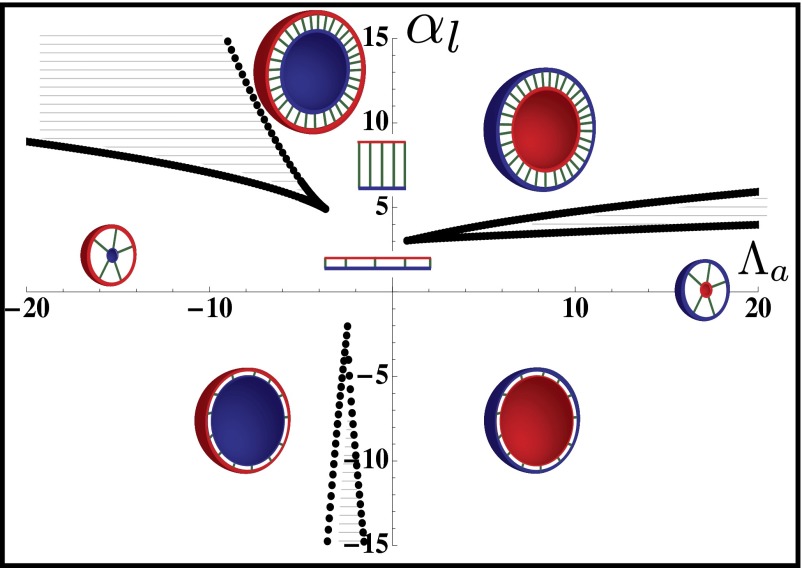
Fig. 4.
Phase diagram of the 3D architecture of epithelial tissue, as a function of apical belt tension  and lateral adhesion
  , for
, for  . The apical side is drawn in red and the basal side in blue. The apical side lines the interior of the sphere if
  , and the exterior is
  . We concentrate on the region
  : The curvature increases for increasing
  , either continuously or discontinuously (hatched regions). The epithelium is more columnar for high values of
  .
.

