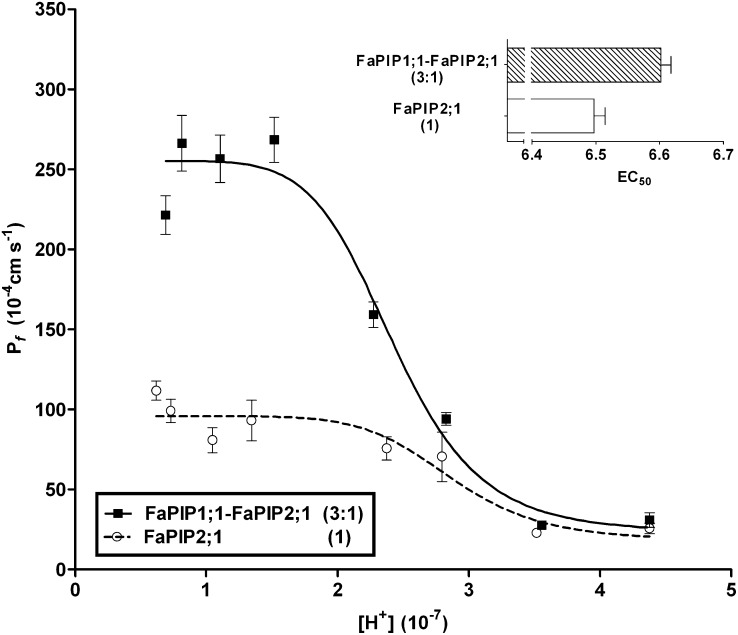
Fig. 2.
Pf inhibitory response triggered by cytosolic acidification for FaPIP1;1–FaPIP2;1 (at a 3:1 cRNA mass ratio) and for FaPIP2;1 expressed alone. Shown is Pf vs. [H+] inhibitory response profile for oocytes injected with FaPIP2;1 cRNA and oocytes injected with FaPIP1;1 and FaPIP2;1 cRNA in a 3:1 mass ratio. The amount of cRNA is represented in parentheses with an arbitrary unit of measure where 1 is equivalent to 1.25 ng of cRNA. The data points are representative values obtained from the same batch of oocytes (mean Pf ± SEM). The data were fitted to an allosteric sigmoidal dose–response curve. (Inset) For each KI ([H+] at which half of the maximum effect occurs), an EC50 value was calculated using  . The mean EC50 value (EC50 ± SEM, n = 3–5) was calculated for each treatment.

