Fig. 7.
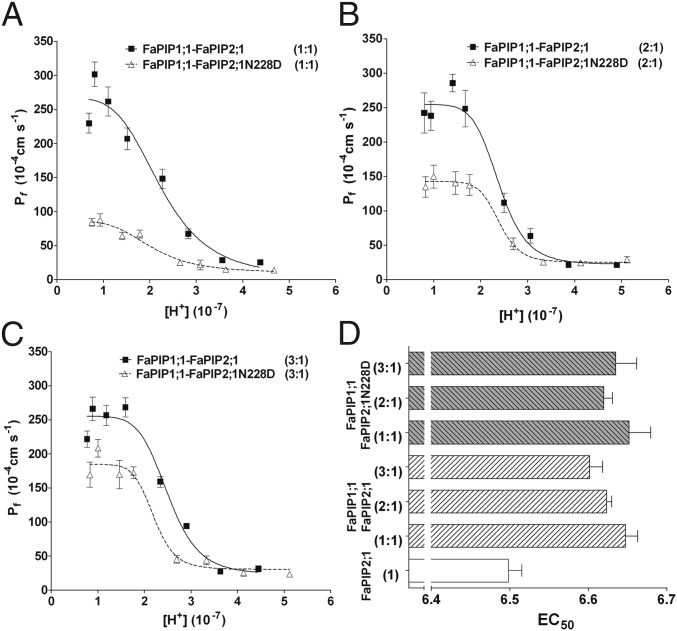
Pf inhibitory response triggered by cytosolic acidification with FaPIP1;1–FaPIP2;1 and FaPIP1;1–FaPIP2;1N228D coexpression. (A–C) Pf vs. [H+] inhibitory response profile for oocytes coinjected with FaPIP1;1 and FaPIP2;1 cRNA and oocytes coinjected with FaPIP1;1 and FaPIP2;1N228D cRNA at 1:1 (A), 2:1 (B), and 3:1 (C) mass ratios. The amount of cRNA is represented in parentheses with an arbitrary unit of measure where 1 is equivalent to 1.25 ng of cRNA. The data points are representative values obtained from the same batch of oocytes (mean Pf ± SEM). Data were fitted to an allosteric sigmoidal dose–response curve. (D) EC50 values reported as the average of three to five independent experiments (EC50 ± SEM, n = 3–5) for each treatment and compared with the FaPIP2;1 EC50 shown in Fig. 2. The FaPIP2;1 EC50 is significantly different from the EC50 values presented in coexpression experiments (P < 0.05).

