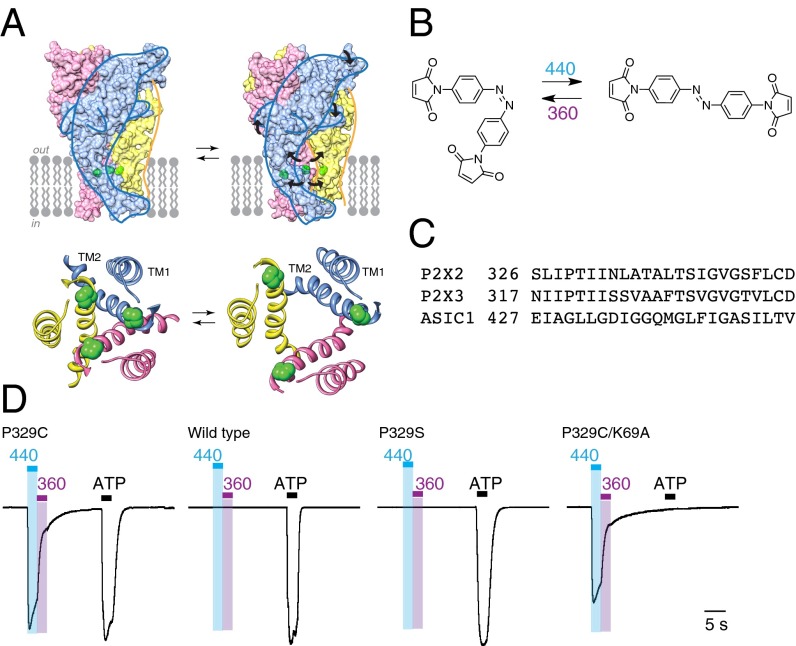
Fig. 1.
Light activation of P2X2 receptors. (A) Models of rat P2X2 receptor showing closed (Left) and open (Right) conformations. (Upper) Space-fill of trimeric holoprotein. (Lower) Ribbon representation of TM domains, from extracellular side. The positions of P329 are indicated in green. (B) BMA, in its cis state (Left) and trans state (Right). (C) Aligned sequences of second transmembrane domains of rat P2X2 and P2X3 receptors, and human ASIC1a. (D) Light-activated P2X2[P329C] receptors. Currents were evoked by illumination at 440 nm (2 s, blue bar) and turned off by illumination at 360 nm (2 s, violet bar). Light-induced currents were 35% ± 4% (n = 11) of the amplitude of maximum currents evoked by ATP. There was no effect of 440-nm or 360-nm illumination at wild-type P2X2 receptors or at P2X2[P329S] receptors (middle traces), but normal responses to ATP. When the P329C mutation was combined with K69A mutation, ATP (100 μM, 2 s) had no effect (right trace), whereas light-induced currents were present. Preincubated for 10–12 min with BMA (10 μM), in each case. ATP was 3, 10, 10, and 100 μM (left to right). Currents normalized to the peak amplitude evoked by ATP, except that P329C/K69A uses the same scale as P329C. Actual peak amplitudes were as follows: P329C 1879 pA, wild type 1937 pA, P329S 1954 pA, and P329C/K69A 1360 pA.

