Fig. 1.
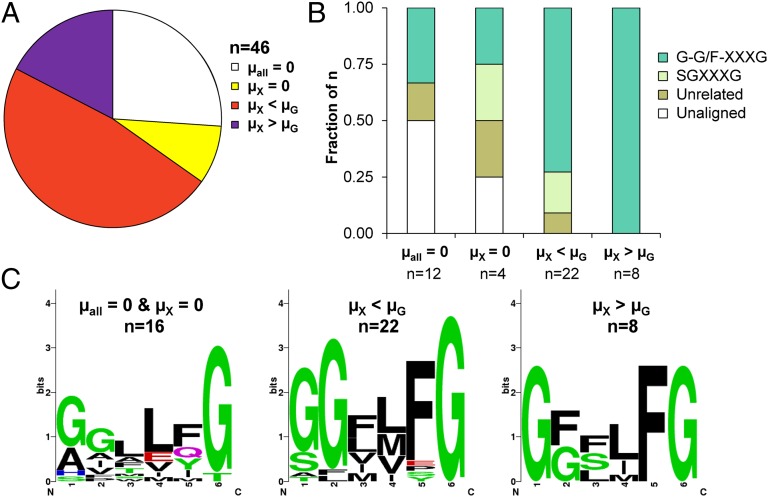
Sequence categorization and phenotypic classification of native and heterologous transporters. (A) The distribution of phenotypic classes for all 46 transporters. (B) The distribution of each sequence category present in each phenotypic class. Transporters containing the conserved motif are enriched in the phenotypic classes that confer growth on xylose. (C) Weblogos of the phenotypic classes illustrate enrichment of the G-G/F-XXXG motif in TMS1. µall = 0 represents no growth in the five carbon sources tested; µX = 0 represents growth on hexoses but not xylose, µX < µG represents growth on xylose is less than that on glucose, and µX > µG represents growth on xylose is greater than that on glucose.

