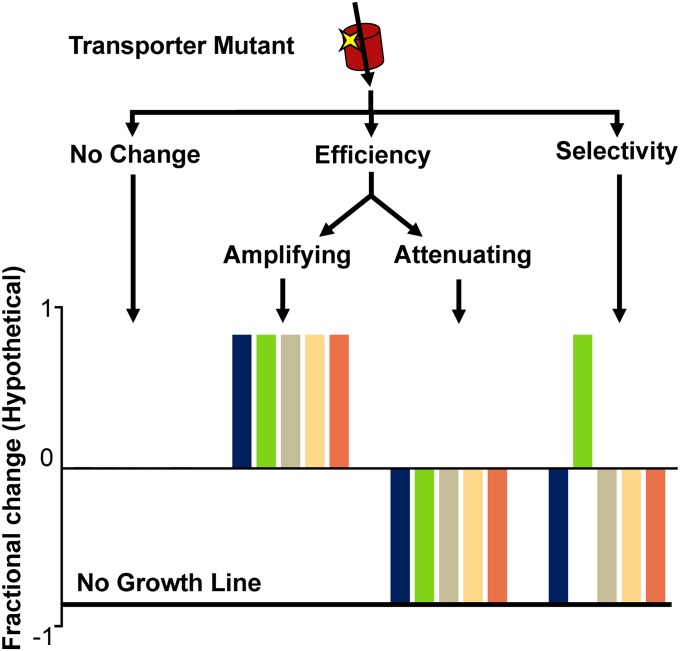
Fig. 2.
Classification tree of fractional change in carbon source growth profile. This figure depicts hypothetical fractional change data to demonstrate how these phenotypes were classified. Little fractional change across all sugars indicates that the substitution does not control efficiency or selectivity in this background. Amplification or attenuation of growth rates across all carbon sources indicates an efficiency substitution. Amplification of growth on one sugar, ideally xylose, and attenuation of all others indicates a selectivity substitution.

