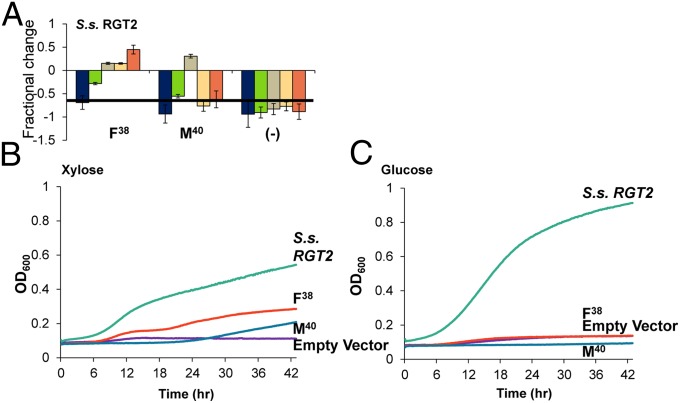
Fig. 6.
Growth characterization of S. stipitis RGT2 and mutants. (A) Fractional change from wild type for the two single mutants and an empty vector control. Error bars were calculated using the sum of least squares method. A bar chart of the exponential growth rates from which fractional change was calculated can be found in SI Appendix. (B) Average growth curves on xylose based on OD600. (C) Average growth curves on glucose based on OD600. Calculated maximum exponential growth rates are shown in SI Appendix, Fig. S7.

