Fig. 2.
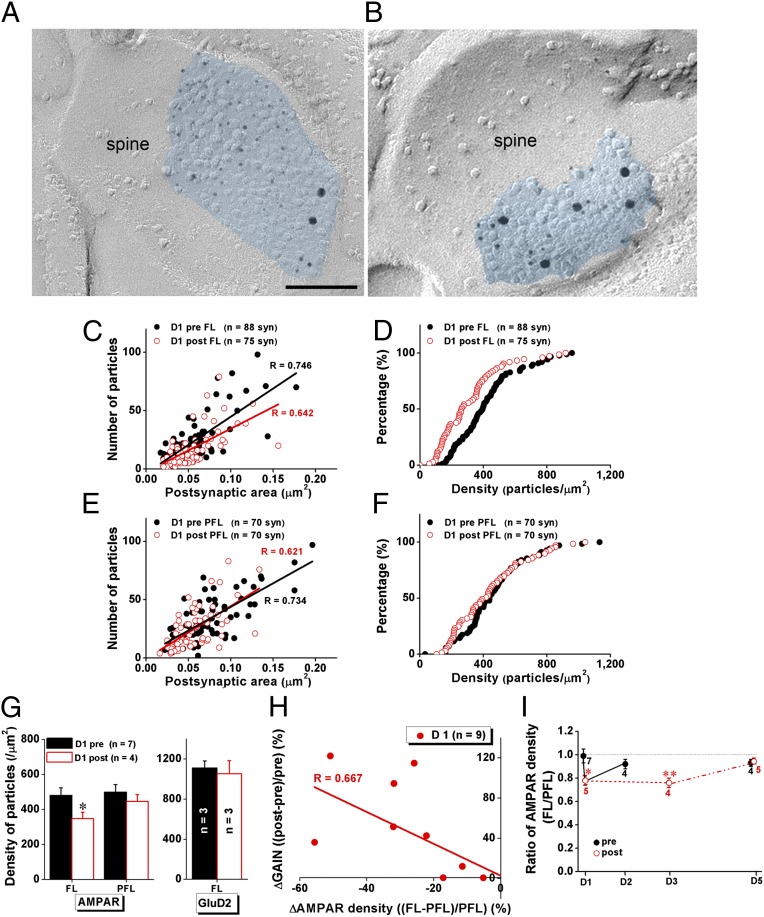
STA is accompanied with rapid and transient reduction in the density of PF–PC synaptic AMPA receptors selectively in the FL. (A and B) Labeling for GluD2 subunits (15-nm gold) and AMPARs (5-nm gold) on freeze-fracture replicas from the FL of mice pre- (A) and post- (B) 1-h training. (Scale bar, 100 nm.) (C–F) Data from representative mice before and after 1-h training showed that STA was accompanied with decreased synaptic AMPAR density in the FL (C) but not PFL (E), and left-shifted distribution of AMPAR densities in the FL (D, two-sample Kolmogorov–Smirnov test: z = 1.863, P = 0.002) but not PFL (F, z = 0.930, P = 0.353). The STA did not change the positive correlation between number of AMPARs and size of postsynaptic area (C and E). (G) Pooled data indicated that the STA was accompanied with decreased AMPAR density in the FL (P = 0.036) but not PFL. No change in GluD2 receptor density was detected in the FL. (H) Data from individual mice at day 1 revealed that the changes in AMPAR density in the FL (normalized to that in the PFL) after 1-h training is negatively correlated with changes in gain (Δgain normalized to pretraining gain, Pearson correlation: R = 0.667, P = 0.002). (I) Density of synaptic AMPARs in the FL significantly decreased after 1-h training on day 1 (D1) and recovered after 24 h (D2). Although density of synaptic AMPARs in the FL also decreased significantly after 1-h training on day 3 (D3), it did not change on day 5 (D5). Black filled circles in C–F and I indicate data obtained before daily training (pre). Red open circles in C–F and I indicate data obtained after daily training (post). Data were presented as mean ± SEM, *P < 0.05, **P < 0.01 vs. D1 pre, Student t test.

