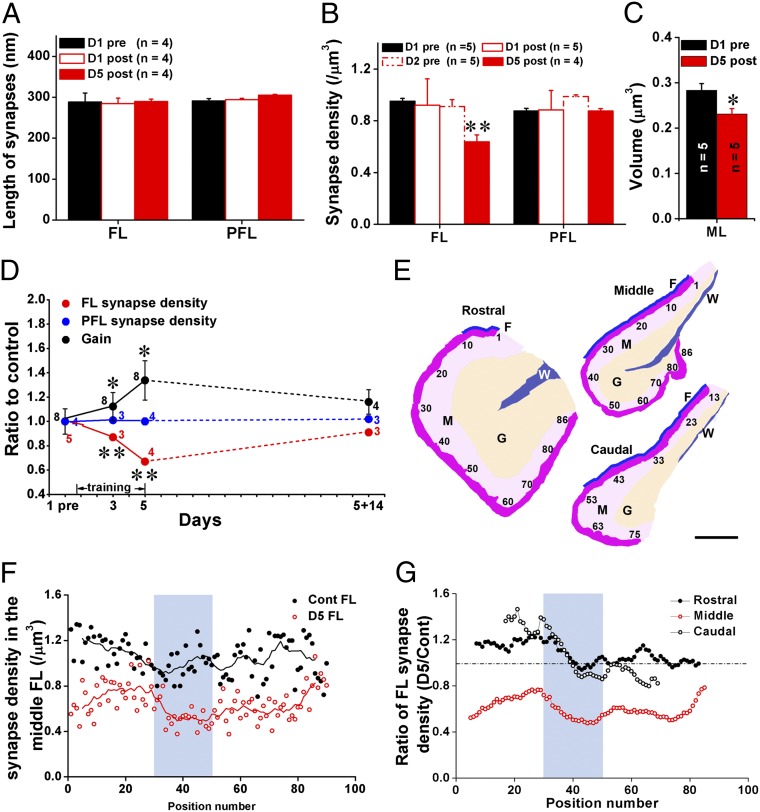
Fig. 3.
LTA is accompanied with persistent but reversible elimination of the target PF–PC synapses. (A) PF–PC synaptic length was not changed at posttraining on day 1 (D1 post) or 5 (D5 post) compared with basal level (D1 pre) in either the FL or PFL. (B) The synaptic density was not changed at posttraining on day 1 (D1 post) or pretraining on day 2 (D2 pre) but decreased by 33% on day 5 (D5 post) compared with D1 pre in the FL. No change was observed in PFL. (C) Volume of the molecular layer in the FL was slightly but significantly decreased on day 5 (D5 post) compared with D1 pre. (D) Daily HOKR training gradually induced LTA which disappeared after 14 d of light-dark cycle exposure (black circles). PF–PC synaptic density showed correlated reduction in the FL (red circles) throughout this time course. The synaptic density in PFL (blue circles) remained unchanged. HOKR gain is expressed as ratio to control at pretraining. (E) Schematic drawing of representative sections of the rostral, middle, and caudal FL showing positions of EM sections used for mapping (shown in F and G) of synaptic density. The sections were sampled near the surface (dark pink) of the ML (M, light pink). The granule cell layer (G) and white matter (W) are indicated in orange and blue, respectively. Fissure between the FL and PFL is indicated with blue line (F). (Scale bar, 200 μm.) (F and G) Mapping analysis of synaptic density in the FL of control (Cont FL) and 5-d trained (D5 FL) mice showed significant reduction of synaptic density (using corresponding nine adjacent values in two groups, paired t test, P < 0.001) throughout the medio–lateral extent of the middle but not rostral and caudal FL. Area used for the physical dissector analysis (light blue) showed a prominent reduction in synapse density at D5 compared with control. Data were presented as mean ± SEM, *P < 0.05, **P < 0.01, vs. D1 pre, Student t test.

