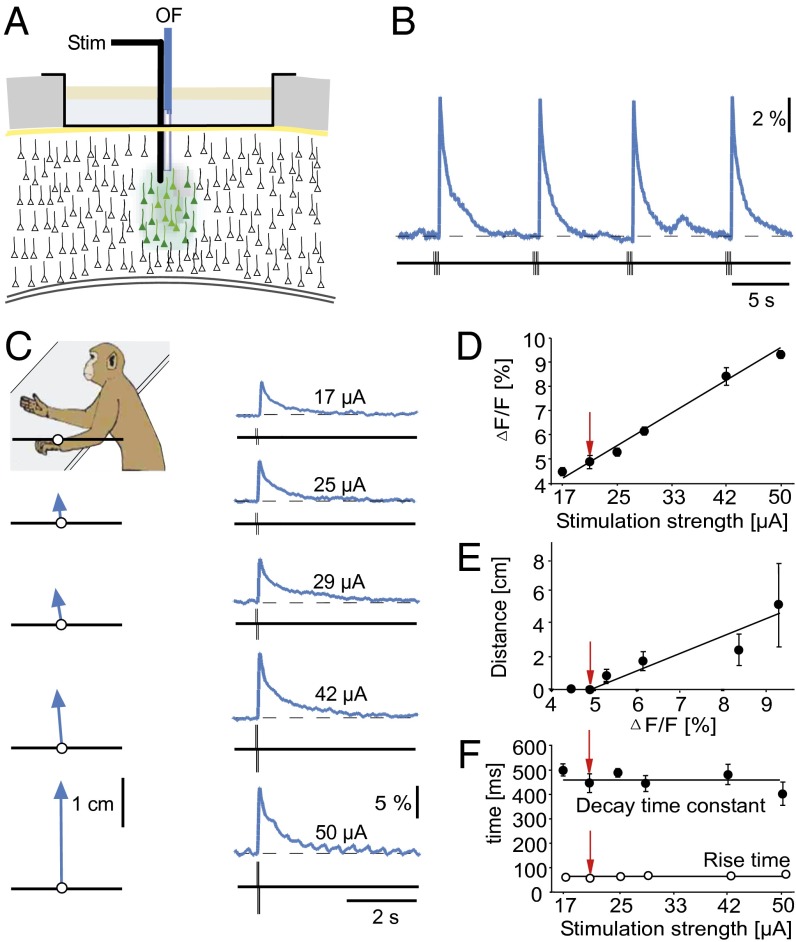
Fig. 2.
Relation between distance of arm movement and magnitude of local cortical activity. (A) Experimental arrangement for electrical microstimulation (Stim) and the simultaneous recording of Ca2+ signals with an optical fiber (OF). (B) Consecutive trials of microstimulation-evoked neuronal Ca2+ signals in M1. Ca2+ signals represent local network activity and were evoked by burst stimulation (eight pulses at 100 Hz, 30 µA). Site of recording/stimulation was in M1 at 3 mm below the cortical surface. (C) Relation between arm movements and Ca2+ signals. The image indicates the resting position of the arm. The stimulation strength of 17 µA evoked a small Ca2+ signal (Upper Right) but no arm movement (Upper Left). At higher stimulation strengths, there is a proportional increase of the movement vector (of constant direction) with the amplitude of the Ca2+ signals. Each stimulus consisted of a burst of four pulses at 100 Hz. (D and E) Plots indicating the linear relations between the stimulation strengths and the amplitudes of the Ca2+ signal (D) and the relations between the Ca2+ signal and the distance of the arm movements (E), respectively. (F) The rise times and decay times of Ca2+ signals were constant for each stimulation pulse. Each data point represents the average of five experimental sessions. The red arrows indicate the stimulus threshold for movements. Note that for some points the error bars are smaller than the symbols.

