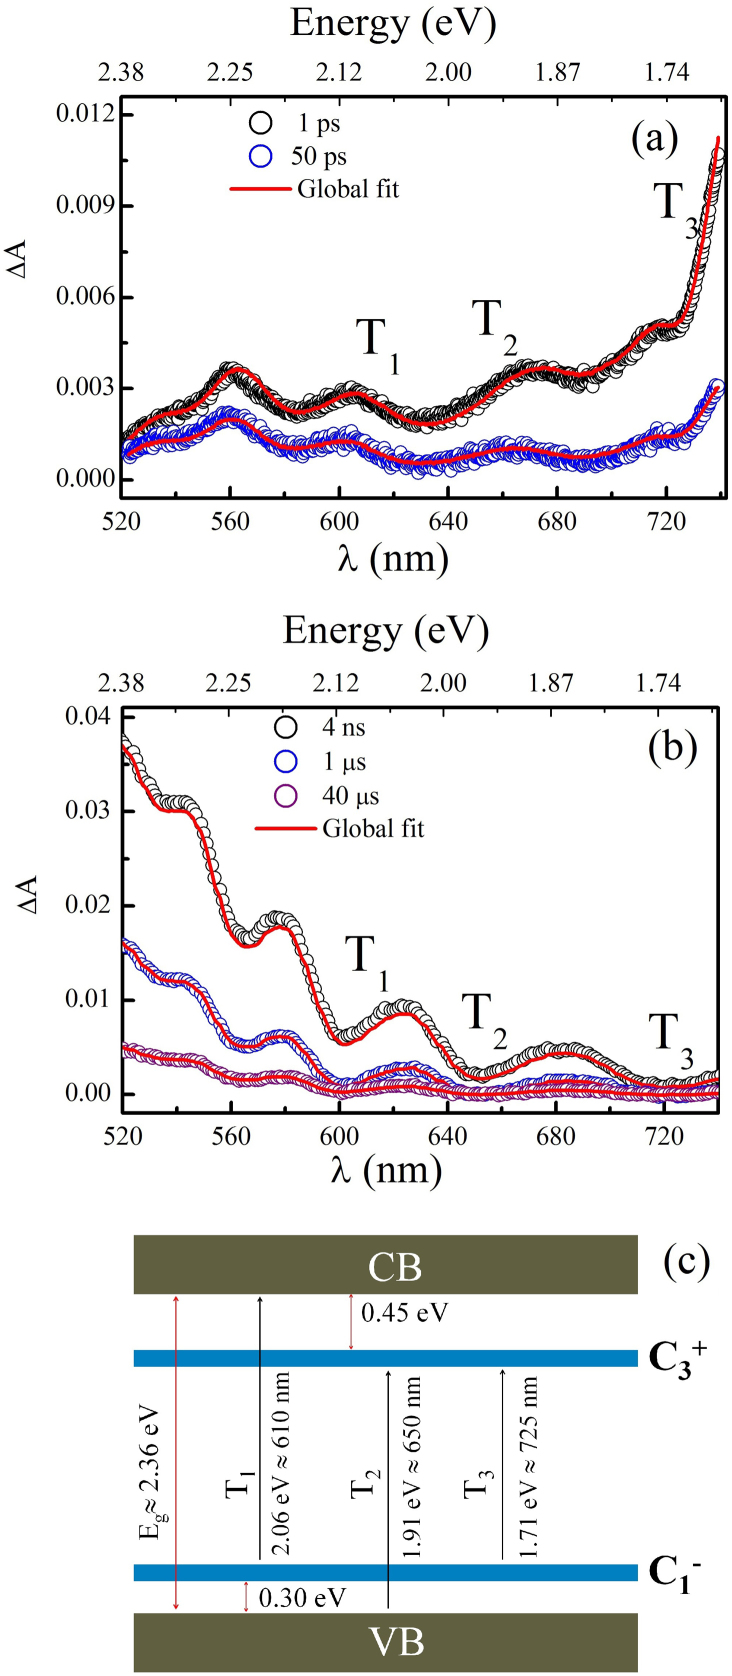
Figure 2. ΔA at various time delays between pump and probe beams for (a) ps (b) μs time scales.
Hollow circles and solid red line represent experimental data and global fit (equ. 3) respectively. Interestingly, LITD relaxes within a short time of nearly 100 μs and the absorption maxima peak changes towards shorter wavelength with time evolution. As time evolves, highly unstable IVAPs completely decay and ΔA shift to shorter wavelength in μs time window since major contribution is from VAPs. (c) shows set of possible electronic transitions (T1, T2, T3) in the sub-bandgap region due to LITDs, these transitions lead to several absorption peaks as marked in figure 3(a & b).

