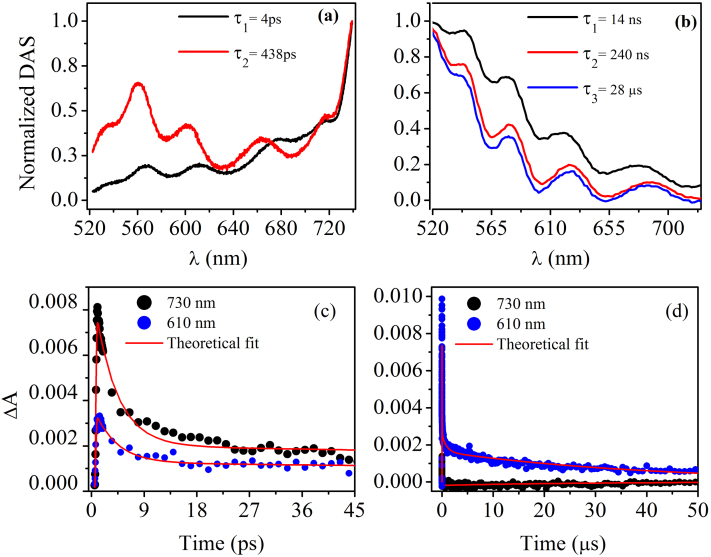
Figure 3. Normalized DAS for different wavelengths (a) ps and (b) μs time scales.
From the figures, it is clearly evident that ΔA max blue shift as time evolves. Time dependence of ΔA at 730 nm (due to IVAP's) and 610 nm (due to VAP's) is shown in (c) ps and (d) μs time scales with corresponding theoretical fit. In short time scales (c) IVAP are more in number and decays fast and as a result at longer time scales (d) results in high absorption at 610 nm due to VAPs, since IVAP's decays completely (ΔA = 0 at 730 nm).

