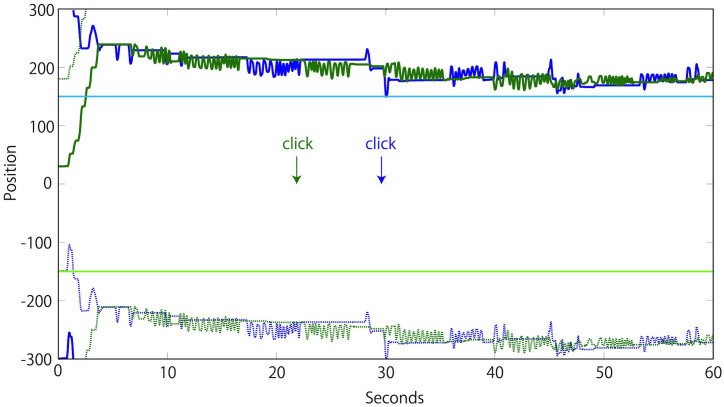
Figure 3. Time series of an illustrative trial.
Recording of the interaction between a pair of players across the 1D virtual environment (y-axis) over the 60-second duration (x-axis) of their 13th trial. Solid dark blue and dark green lines represent the positions of the two avatars, while the dotted blue and green lines represent the positions of their shadows. The solid light blue and light green lines represent the location of each player's specific static object. The arrows indicate the time of click for each player. From 5 s onwards a turn-taking (TT) interaction is noticeable (see the Methods section for a detailed explanation of how TT is measured). The green player's TT performance was nearly perfect because, during the 10 s before her click, there was a well-coordinated mutual exchange: first green stimulated while blue remained passive and then the roles were reversed (TT level of 0.88). The blue player's TT level was also good but slightly lower. There was a well-coordinated exchange of turns during much of the 10 s preceding her click, but this ended with a mismatch during the final seconds: blue failed to stimulate continuously in response to green's becoming passive (TT level of 0.52). Both players reported that they had a clear awareness of the other at the time of their click (PAS ratings of 4).

