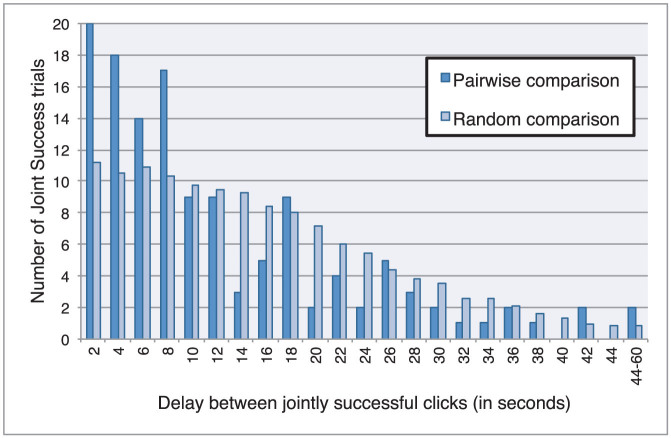
Figure 4. Jointly successful players synchronized with each other.
Clicks in Joint Success trials tended to happen close in time, even though players could not directly sense the occurrence of the other's click. The histogram shows the frequency of trials (y-axis) given a range of temporal delays between clicks (x-axis). The pairwise comparison represents the distribution of delays between two clicks within each Joint Success trial. The most frequent delay was for clicks to occur in less than two seconds of each other (20 trials). The random comparison represents the distribution of delays between randomly paired clicks across the set of Joint Success trials (we calculated the delays between all jointly successful clicks and normalized the results). Short delays (<10 s) tend to occur more frequently in the case of pairwise comparison than random comparison, which means that synchronization of players is an interactive achievement. It cannot be explained by their independent entrainment to an external factor (e.g. absolute trial time in seconds), since such a factor would be unaffected by the randomization of comparisons across trials.

