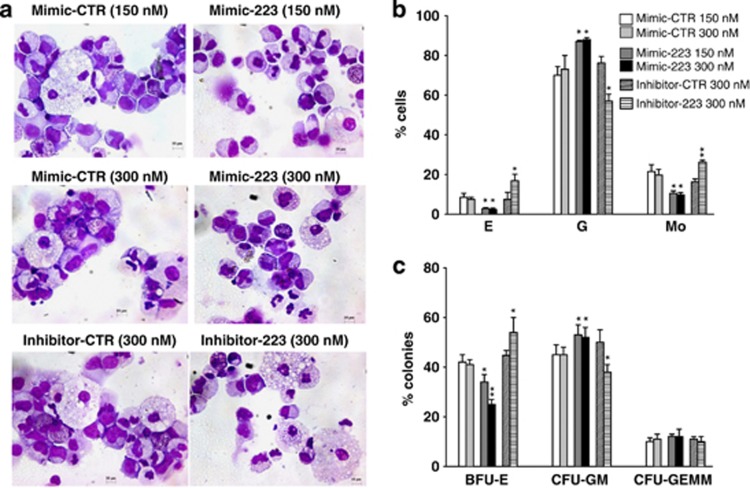
Figure 5.
Modulation of miR-223 activity in CD34+HSCs. CD34+HSCs were transfected with the indicated concentrations of miR mimic negative control (mimic-CTR), miR-223 mimic (mimic-223), miRNA hairpin inhibitor negative control (Inhibitor-CTR) and miR-223 hairpin inhibitor (inhibitor-223). (a) Representative Wright–Giemsa staining of transfected cells undergoing multilineage cultures (day 14 of culture). Scale bar, 10 μM. (b) Morphological evaluation of the percentage of erythroid (E), granulocytic (G) and monocytic/macrophagic (Mo) cells detectable after 14 days of multilineage liquid cultures. (c) Percentage of BFU-E, CFU-GM and CFU-GEMM growth in methylcellulose medium (14 days of culture). Error bars represent S.D. of three independent evaluations. *P<0.05; **P<0.001

