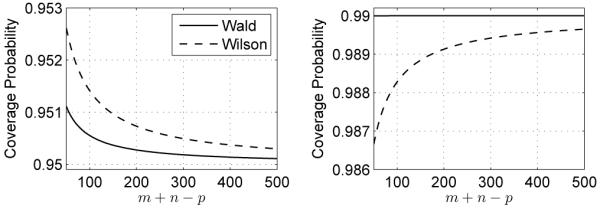
Fig. 3.

Coverage probabilities of approximate 95% (Left) and 99% (Right) Wald and Wilson confidence intervals for SNR. Note that the coverage probability plot for the exact 95% confidence interval introduced in Section IV would simply be a horizontal line at 0.95. Likewise the plot for the exact 99% confidence interval is a horizontal line at 0.99.
