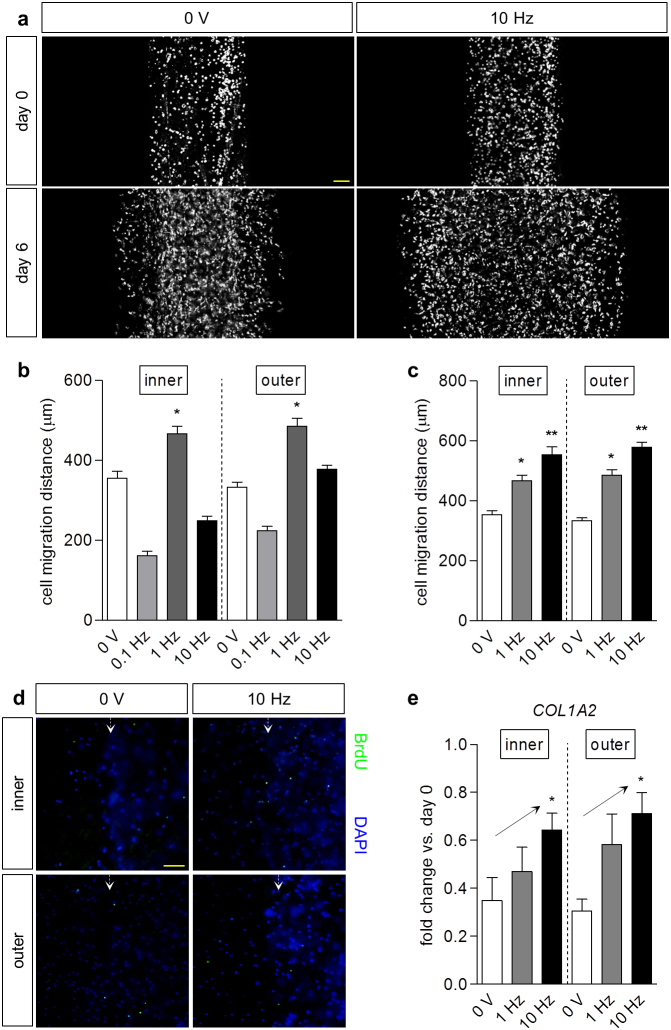
Figure 2. Electrical stimulation enhanced meniscus cell migration.
(a) Representative images of inner meniscus cell migration in a micropatterned hydrogel system with (10 Hz) and without (0 V) electrical stimulation, before (day 0) and after 3 days of pre-culture and 3 days (day 6) of stimulation (3 V/cm, 10 Hz, 0.2 ms pulse duration) or no stimulation (0 V). Scale bar: 200 μm. (b) Optimization of stimulation frequency. Parameters were held constant at 3 V/cm, 2 ms pulse duration, with varying frequency (0.1, 1, 10 Hz). Migration distances at day 6 demonstrated increases for inner and outer meniscus cells at 1 Hz versus cells without stimulation (0 V). * p < 0.05 vs. 0 V; n = 38–194. (c) Maintenance of charge injection. Field strength was held constant at 3 V/cm, with varying frequency and pulse duration. A higher frequency (10 Hz) and shorter pulse duration (0.2 ms) further enhanced inner and outer meniscus cell migration at day 6. * p < 0.05 vs. 0 V; ** p < 0.05 vs. 0 V, 1 Hz; n = 68–252. (d) Immunofluorescence staining of migrating inner and outer cells at day 6 with (3 V/cm, 10 Hz, 0.2 ms pulse duration) or without (0 V) stimulation, against BrdU for proliferating cells and DAPI for nuclei. No overt differences in cell proliferation were apparent between the cell types with and without stimulation. Scale bar: 200 μm. (e) Fold change (2−ΔΔCT) in gene expression of COL1A2 in meniscus cells at day 6 relative to cells at day 0, respectively, both normalized to GAPDH. Increasing frequency of stimulation with maintenance of injected charge (3 V/cm, 1 Hz, 2 ms or 3 V/cm, 10 Hz, 0.2 ms pulse duration) led to upward trends in gene expression. * p < 0.05 for linear trend; n = 5–10.

