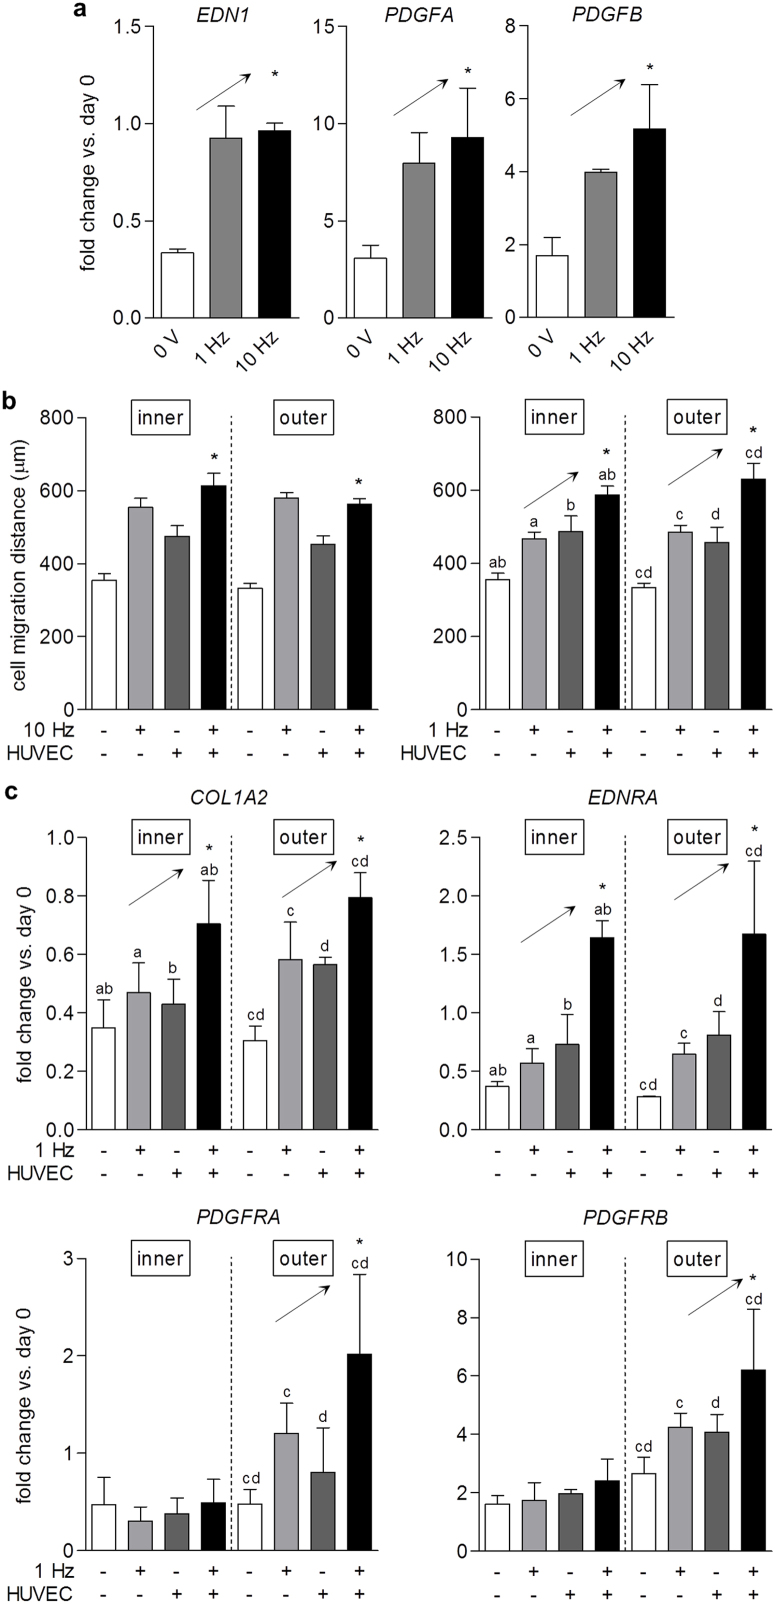
Figure 3. Cooperative action of electrical stimulation and endothelial cells on meniscus cell migration.
(a) Fold change (2−ΔΔCT) in gene expression of EDN1, PDGFA, and PDGFB in HUVECs at day 6 relative to cells at day 0, respectively, both normalized to GAPDH. Increasing frequency of stimulation with maintenance of injected charge (3 V/cm, 1 Hz, 2 ms or 3 V/cm, 10 Hz, 0.2 ms pulse duration) led to upward trends in gene expression. * p < 0.05 for linear trend; n = 3–4. (b) Optimization of electrical stimulation parameters for co-culture of HUVECs and meniscus cells. Meniscus cell migration with HUVECs and stimulation at 3 V/cm, 10 Hz, 0.2 ms pulse duration (10 Hz) was greater than with HUVECs alone at day 6 (left). * p < 0.05 vs. + HUVEC; n = 37–154. Meniscus cell migration with HUVECs and stimulation at 3 V/cm, 1 Hz, 2 ms pulse duration (1 Hz) demonstrated cooperative, upward trends with the addition of each stimulus at day 6 (right). * p < 0.05 for linear trend (analysis of groups indicated by the same letter); n = 24–194. (c) Fold change (2−ΔΔCT) in gene expression of COL1A2, EDNRA, PDGFRA, and PDGFRB in meniscus cells at day 6 relative to cells at day 0, respectively, both normalized to GAPDH. Increasing frequency of stimulation with maintenance of injected charge (3 V/cm, 1 Hz, 2 ms or 3 V/cm, 10 Hz, 0.2 ms pulse duration) led to upward trends in gene expression. * p < 0.05 for linear trend (analysis of groups indicated by the same letter); n = 3–10.

